This article is the third in the "IAMMETER Energy Consumption Report" series (for the first article, please see 13.1 Bill Reports,for the second article, please refer to 13.2 Energy Consumption Analysis ).
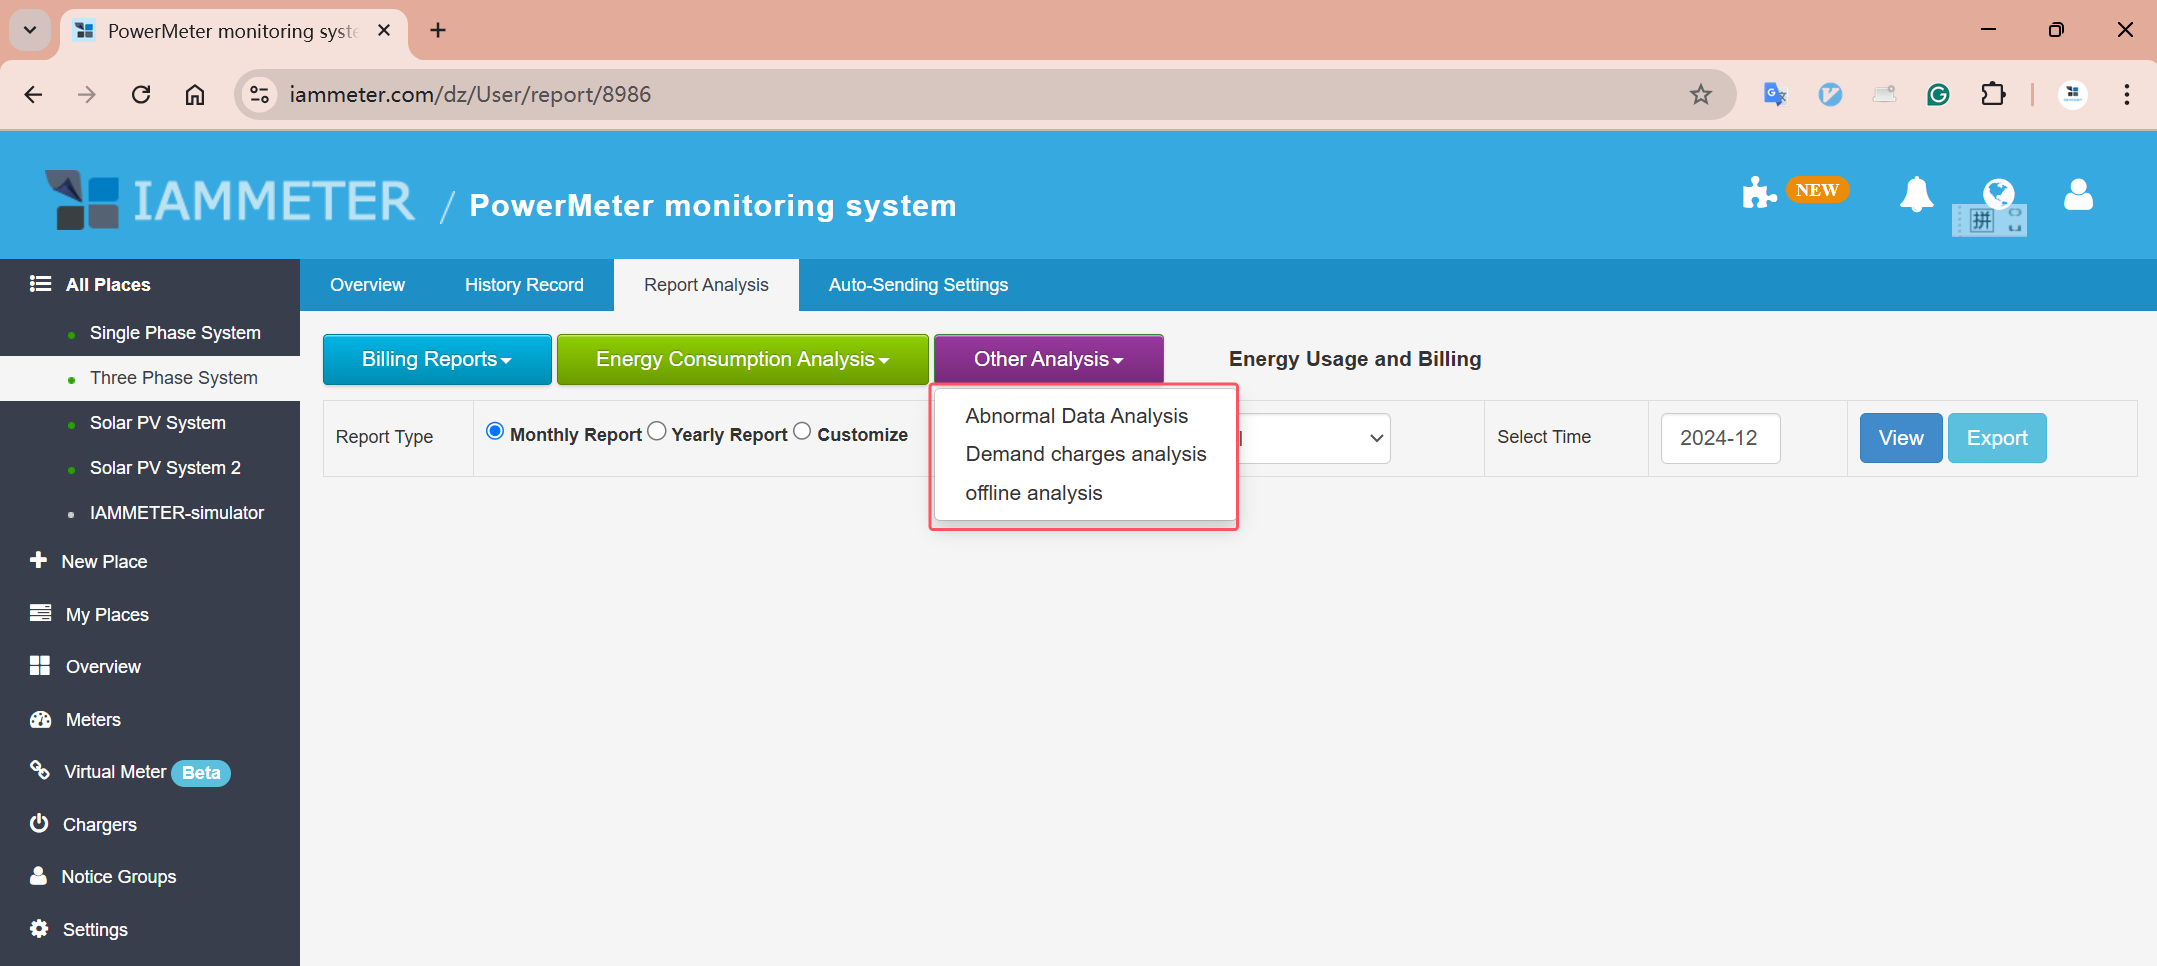
This includes the following report content:
This report helps customers analyze the quantity and proportion of abnormal data.
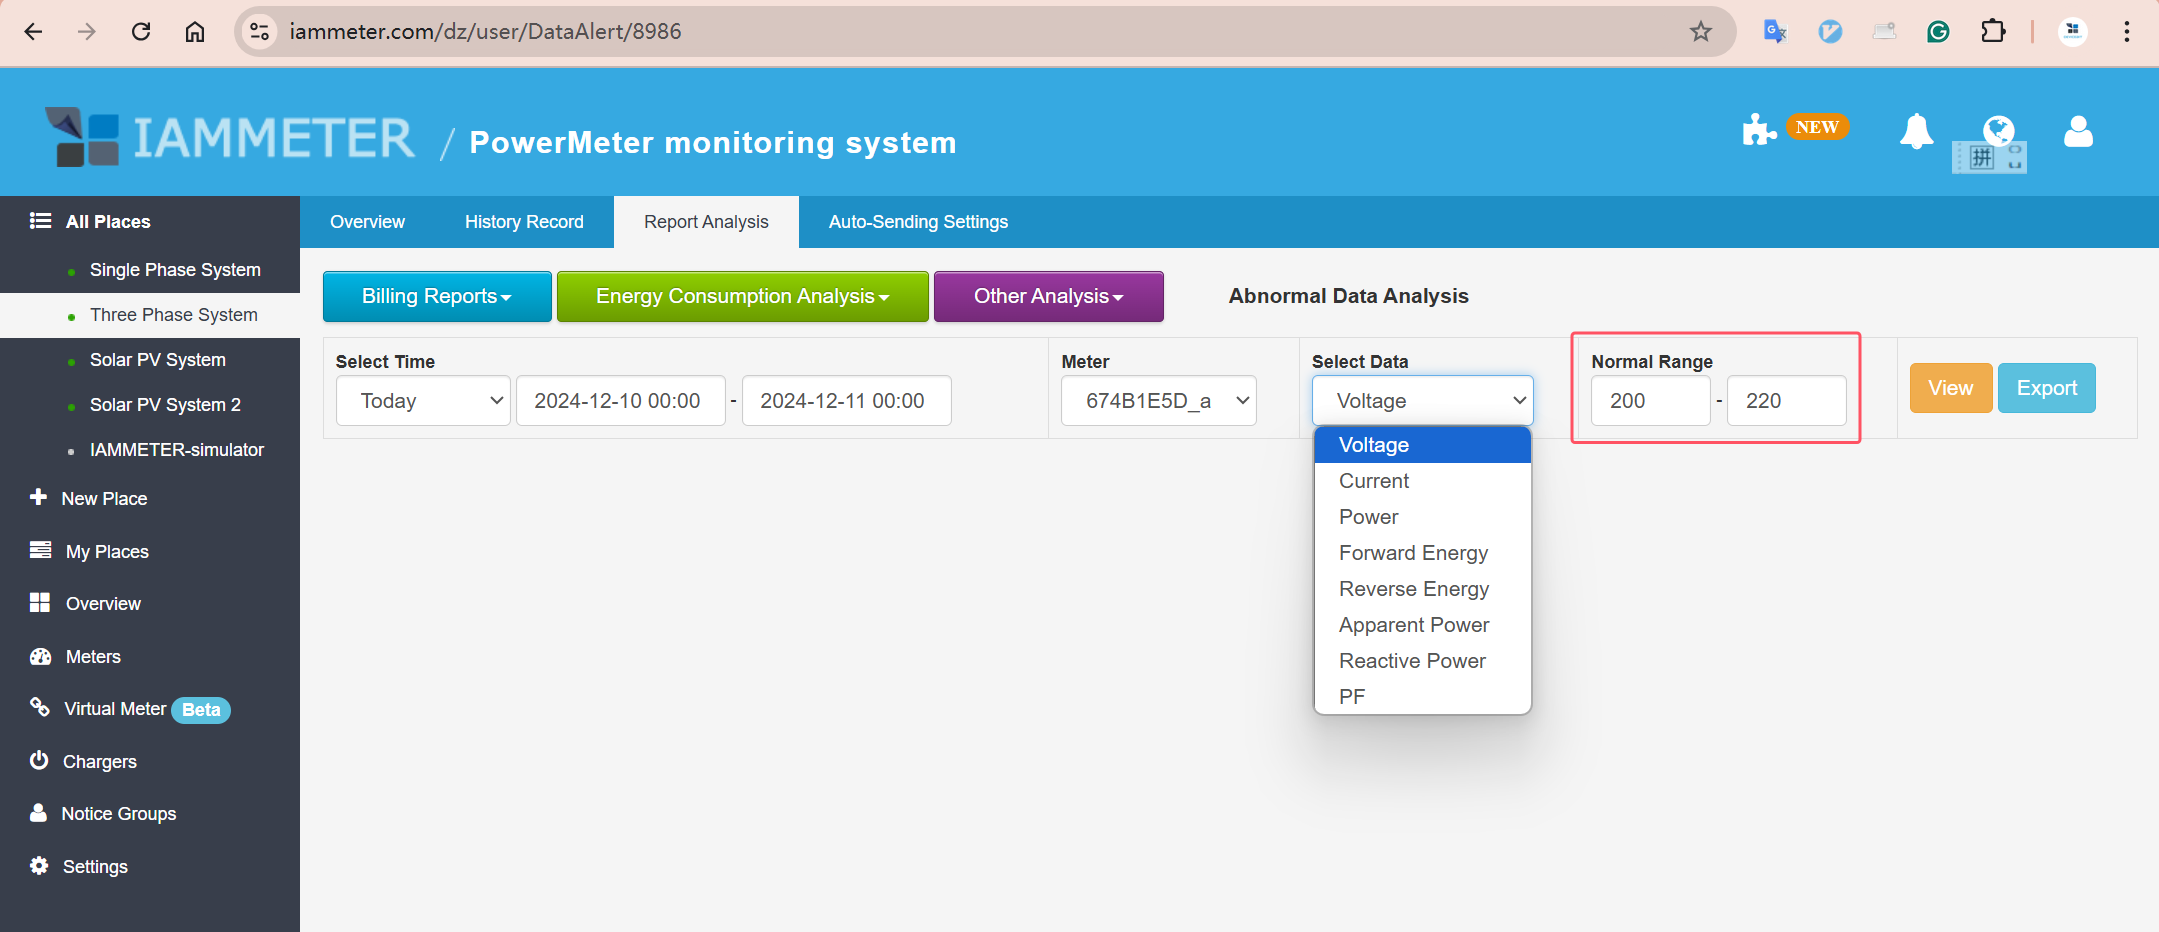
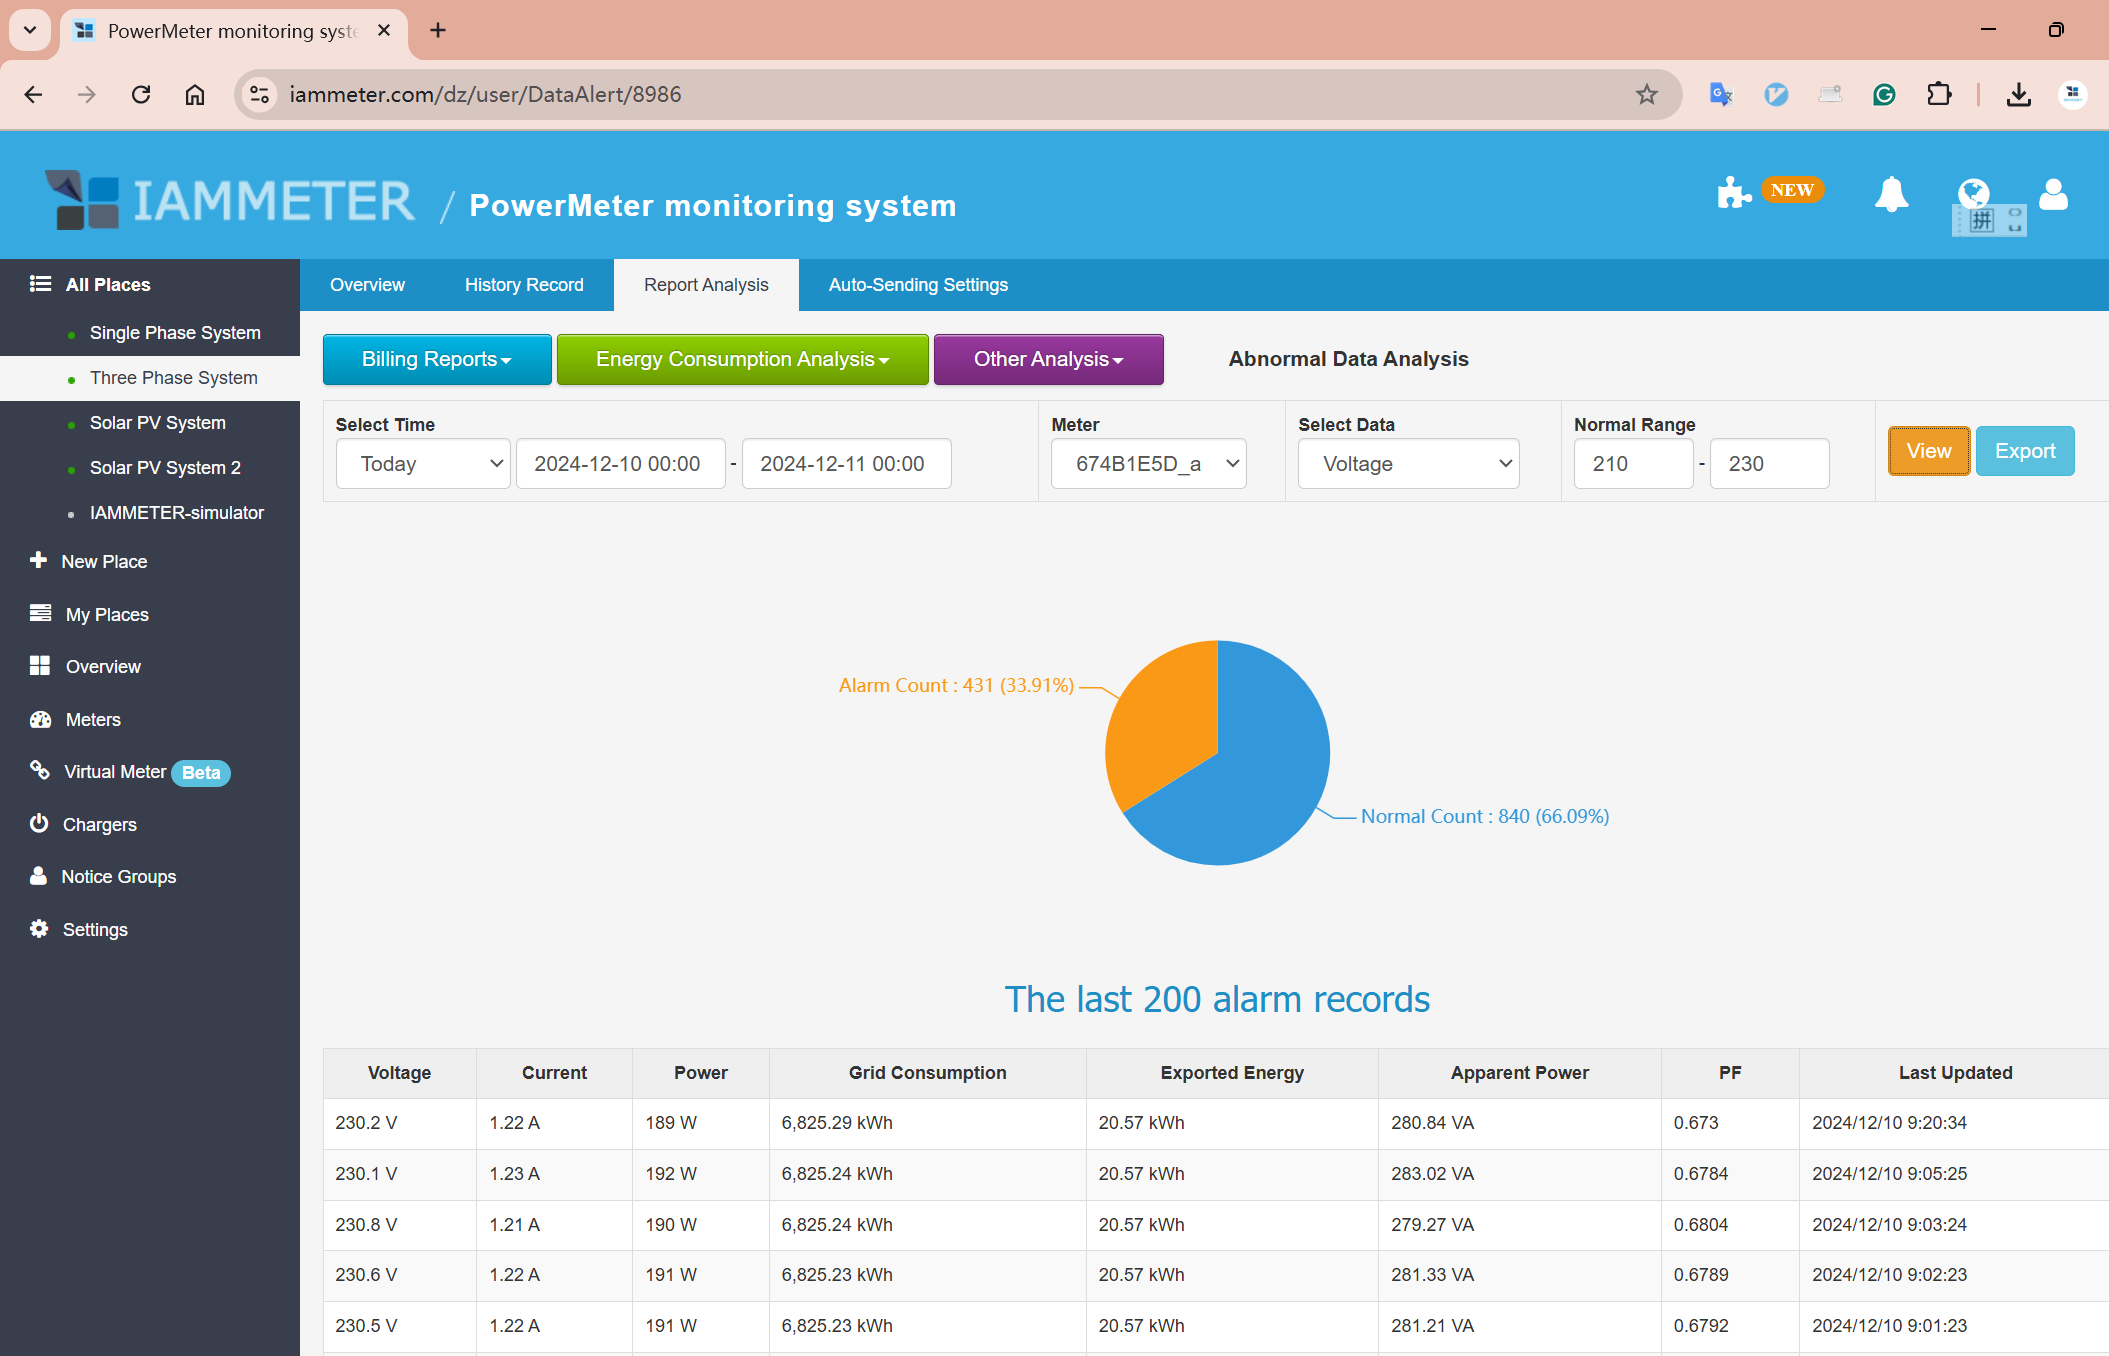
As shown below, the voltage range of 210V-230V is set as the normal range (for demonstration purposes only). The analysis covers all power readings from December 10 to December 11, 2024.
After the report analysis, it was found that 431 voltage readings exceeded the specified range, accounting for 33.91% of the total readings.
"A demand charge is applied to end users who have the largest energy demands (e.g., large multifamily and apartment buildings; commercial, industrial, educational, and healthcare facilities; etc.). For many commercial customers, the demand charge can account for 30% to 70% of a monthly electricity bill."
Analyze your Demand Charge in IAMMETER
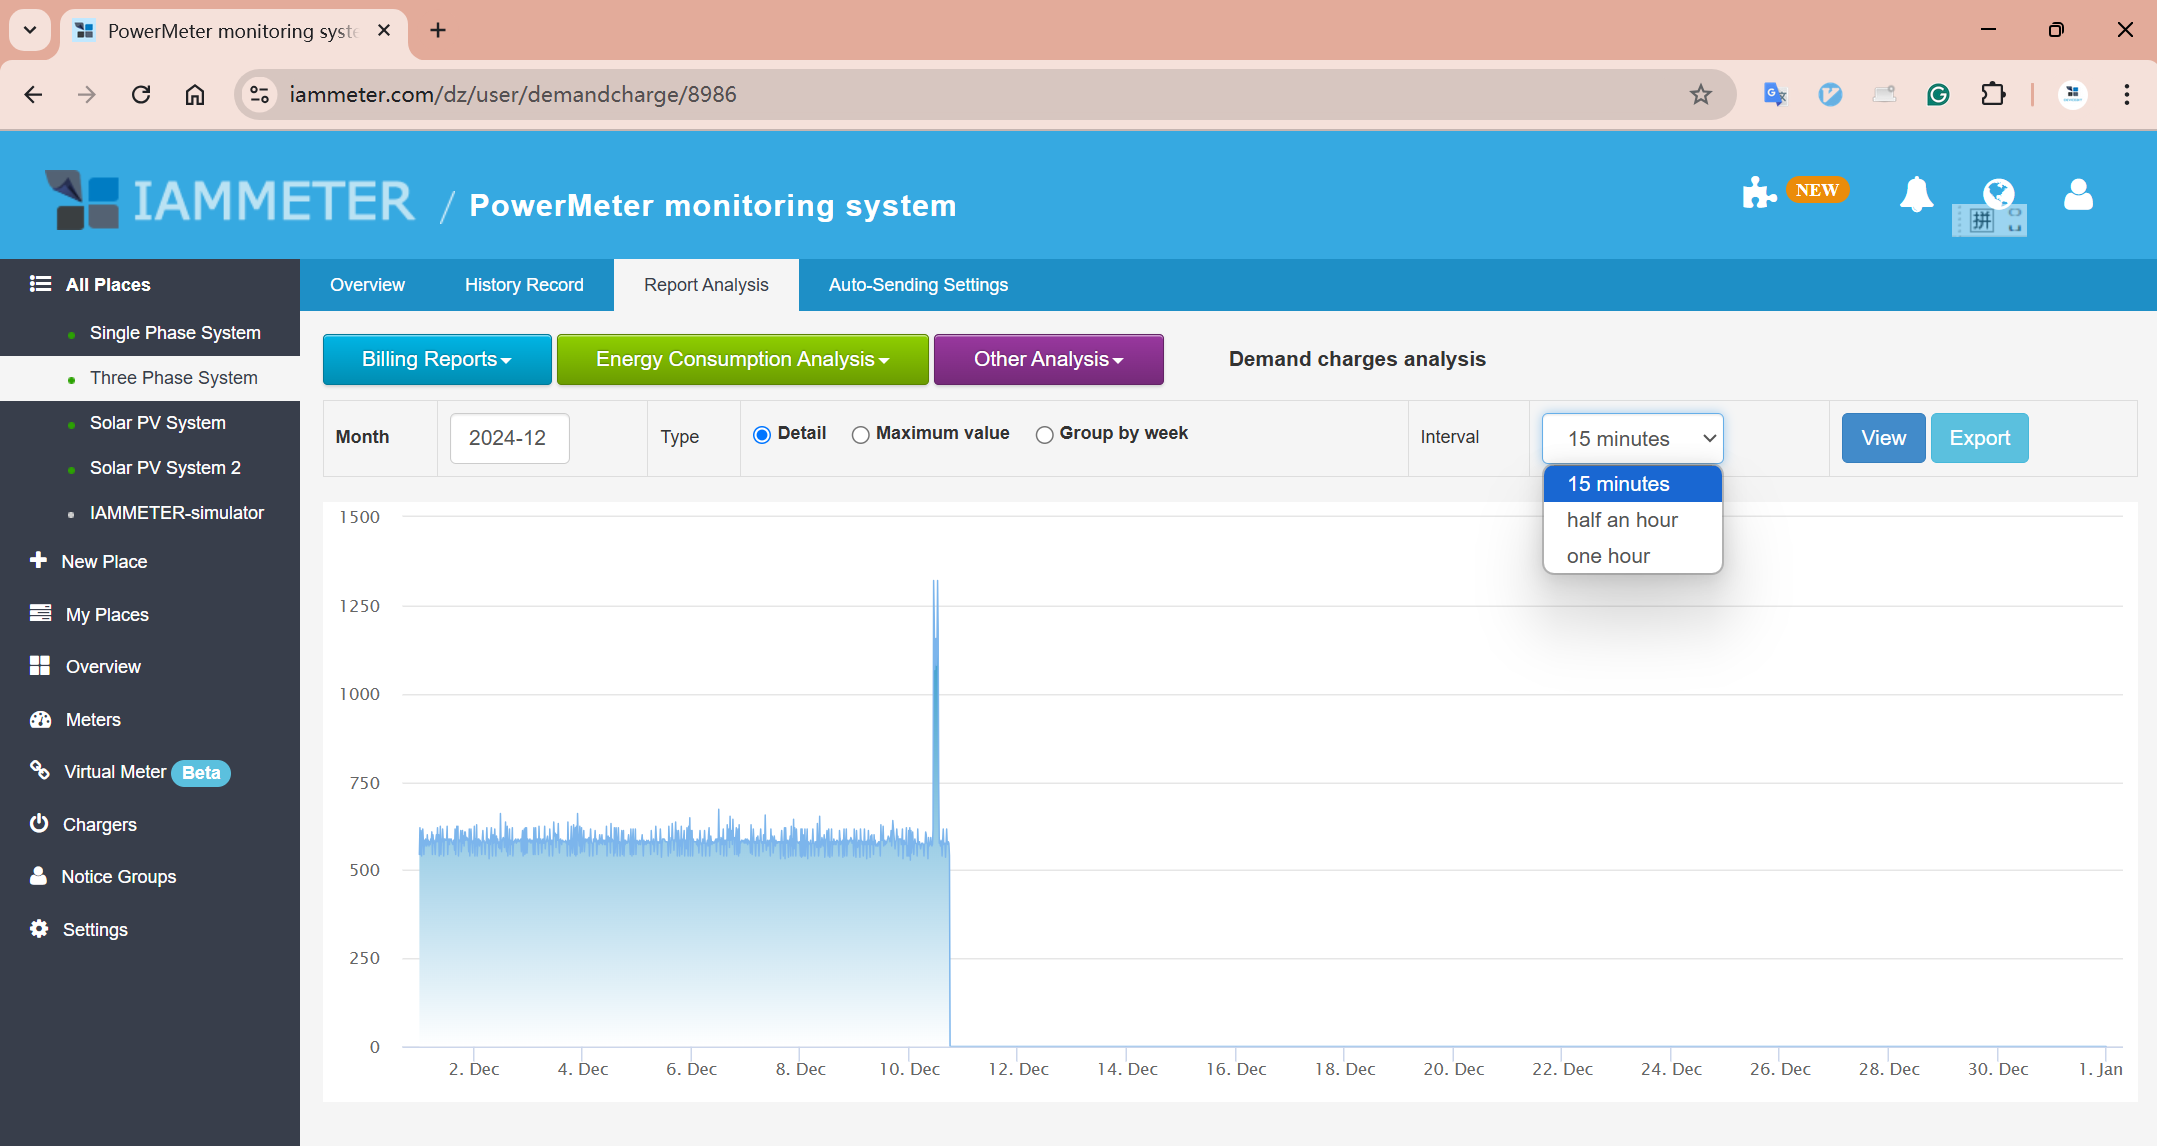
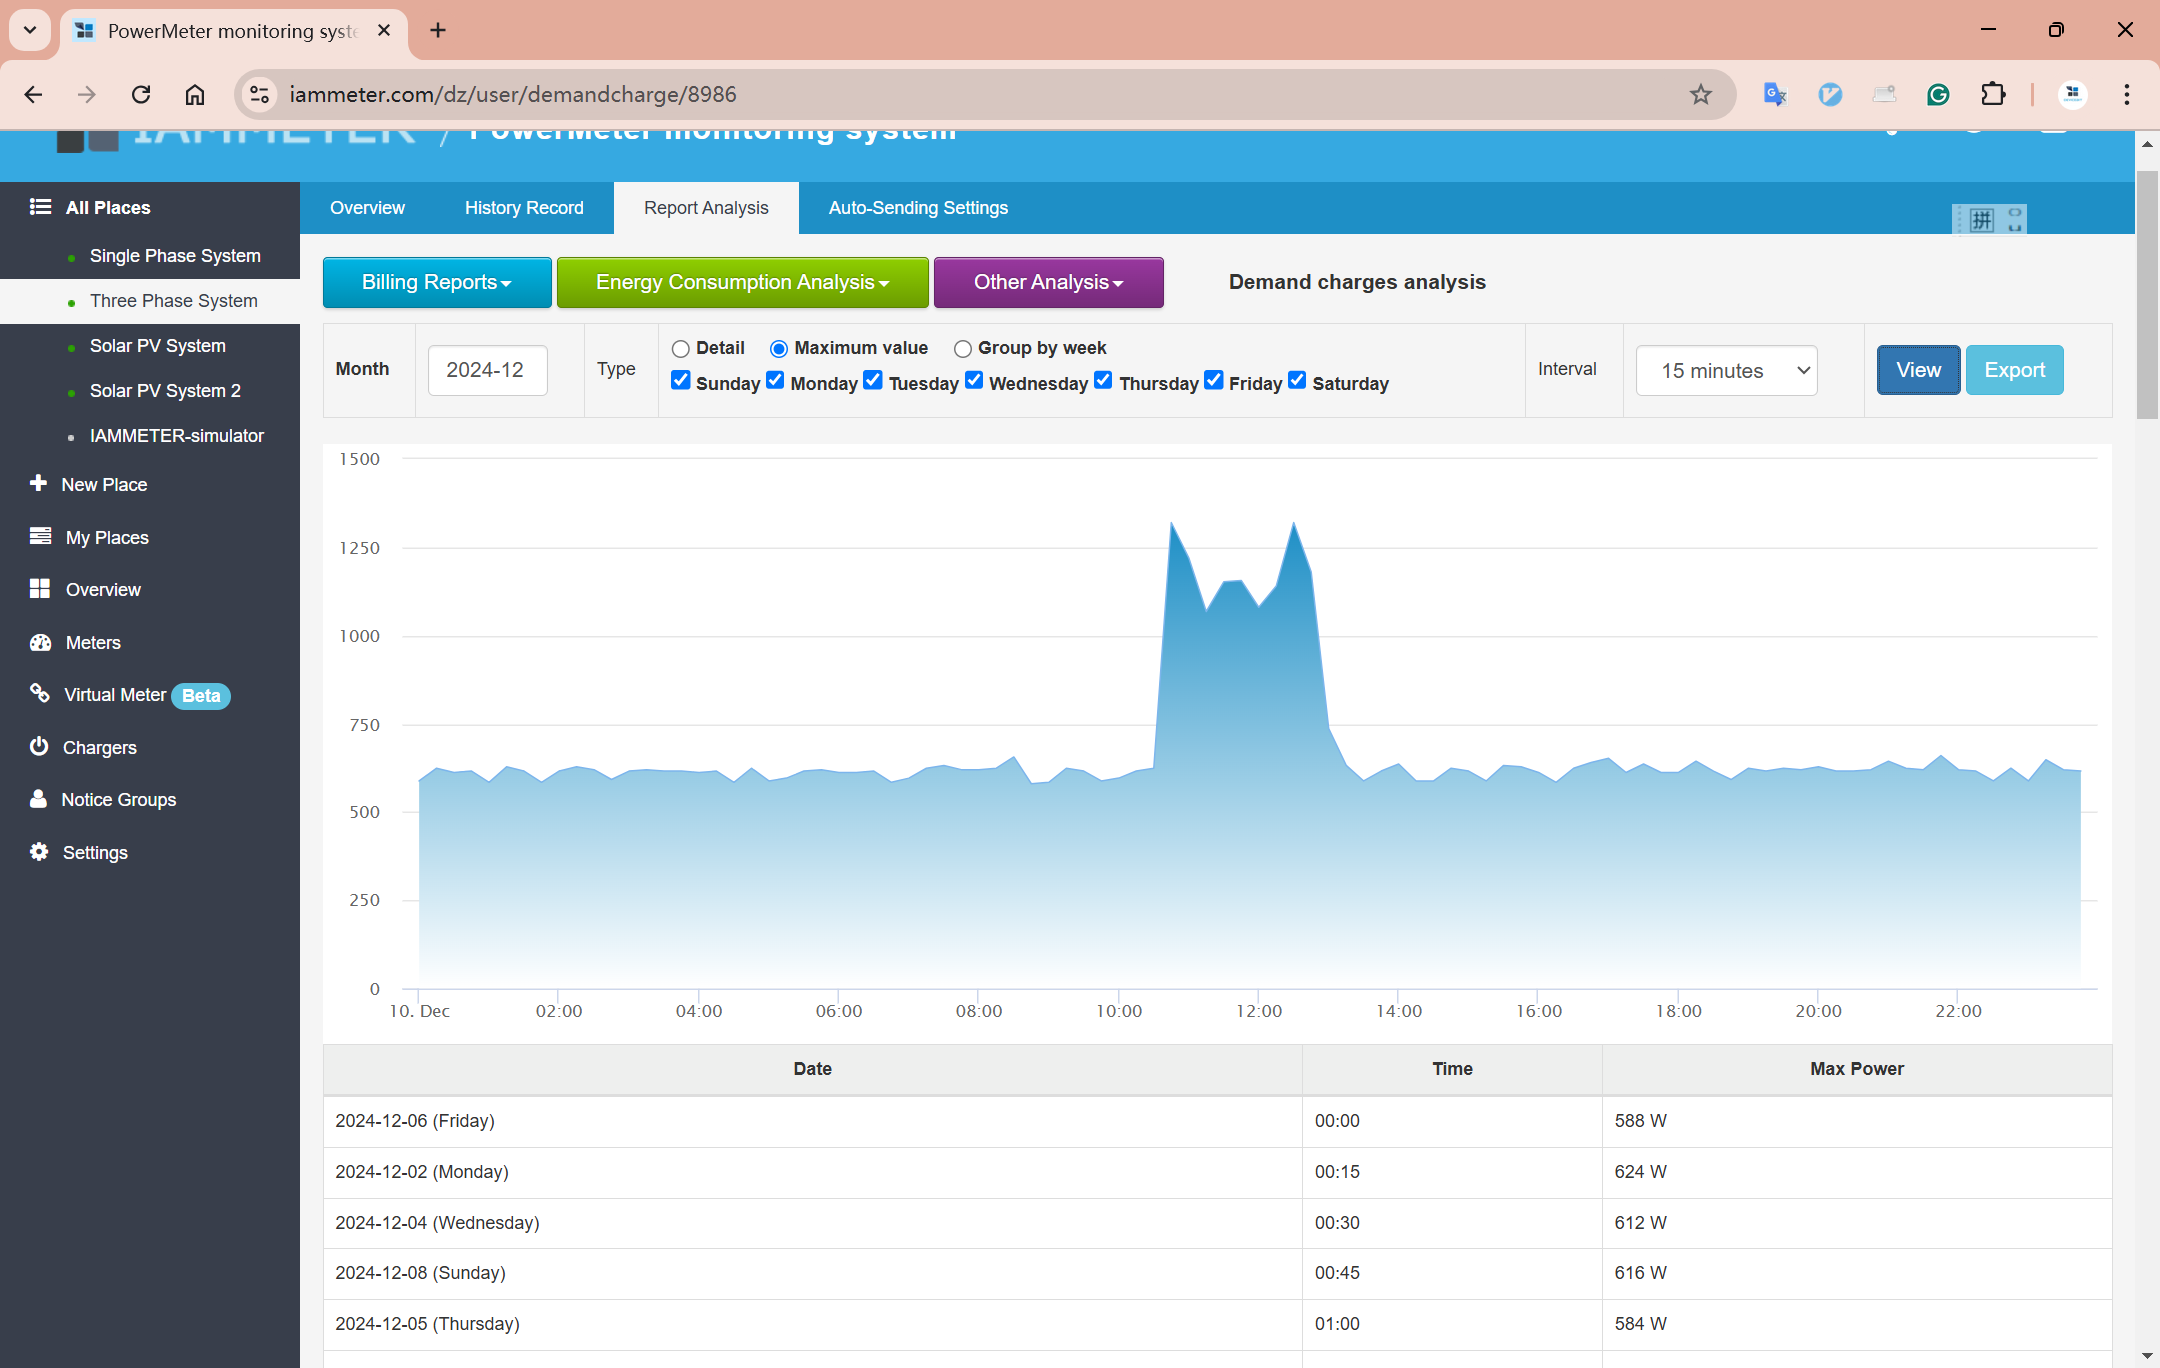
Analyze the maximum power within 15-minute intervals
Filter by day of the week to analyze the maximum power
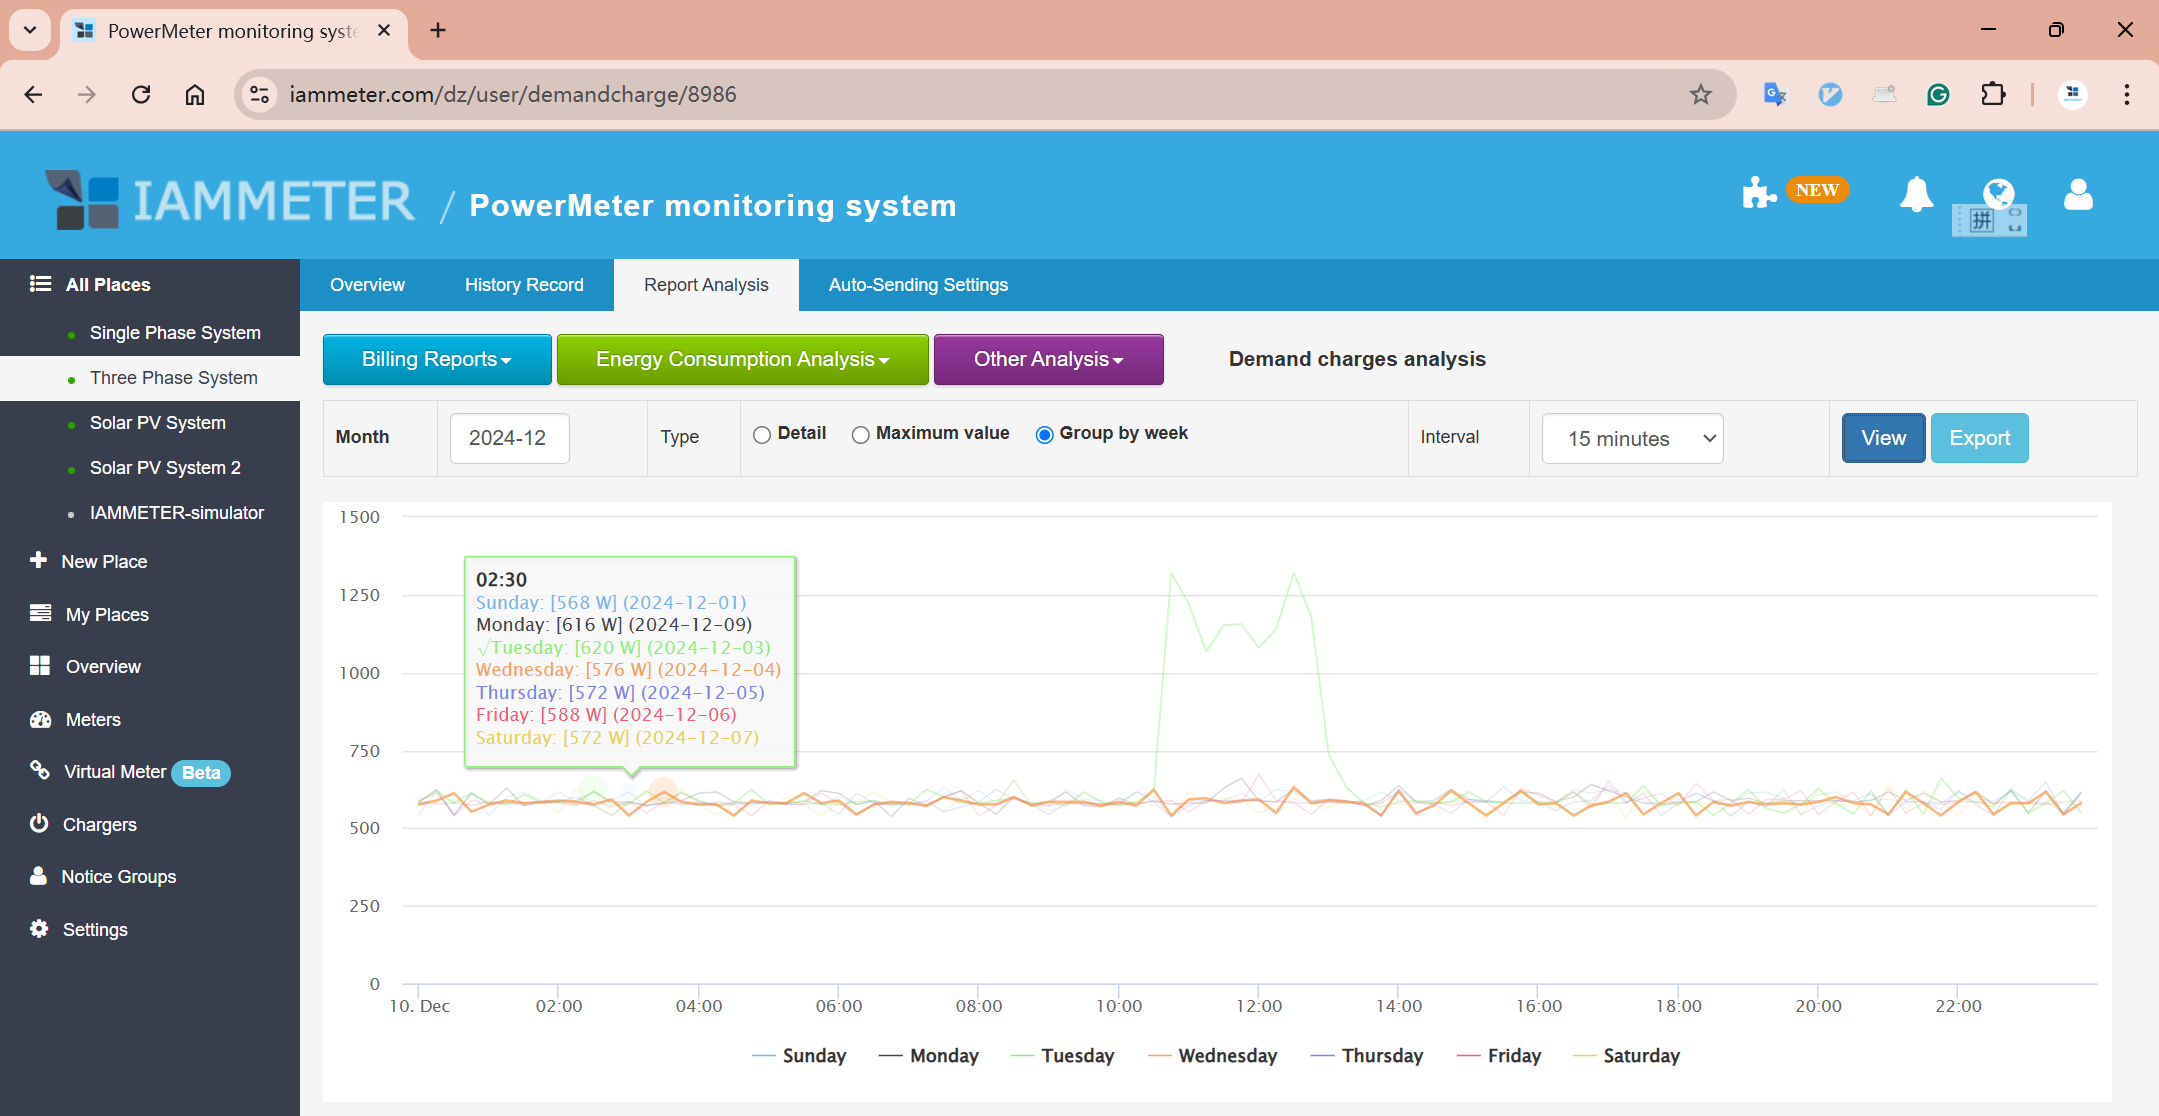
Group by day of the week to analyze the average maximum power for each interval
The seven curves in the chart below represent Monday to Sunday. The curve values indicate the maximum power for every 15 minutes over 24 hours in a day.
Please note that each curve is an aggregated result. For example, if there are five Mondays in December, the values of the Monday curve are the averages of the five corresponding data points.
This report analyzes the number and proportion of data upload interruptions.
Due to network issues or other factors, data uploads may be interrupted (the meter will automatically resume uploads as soon as the network is restored).
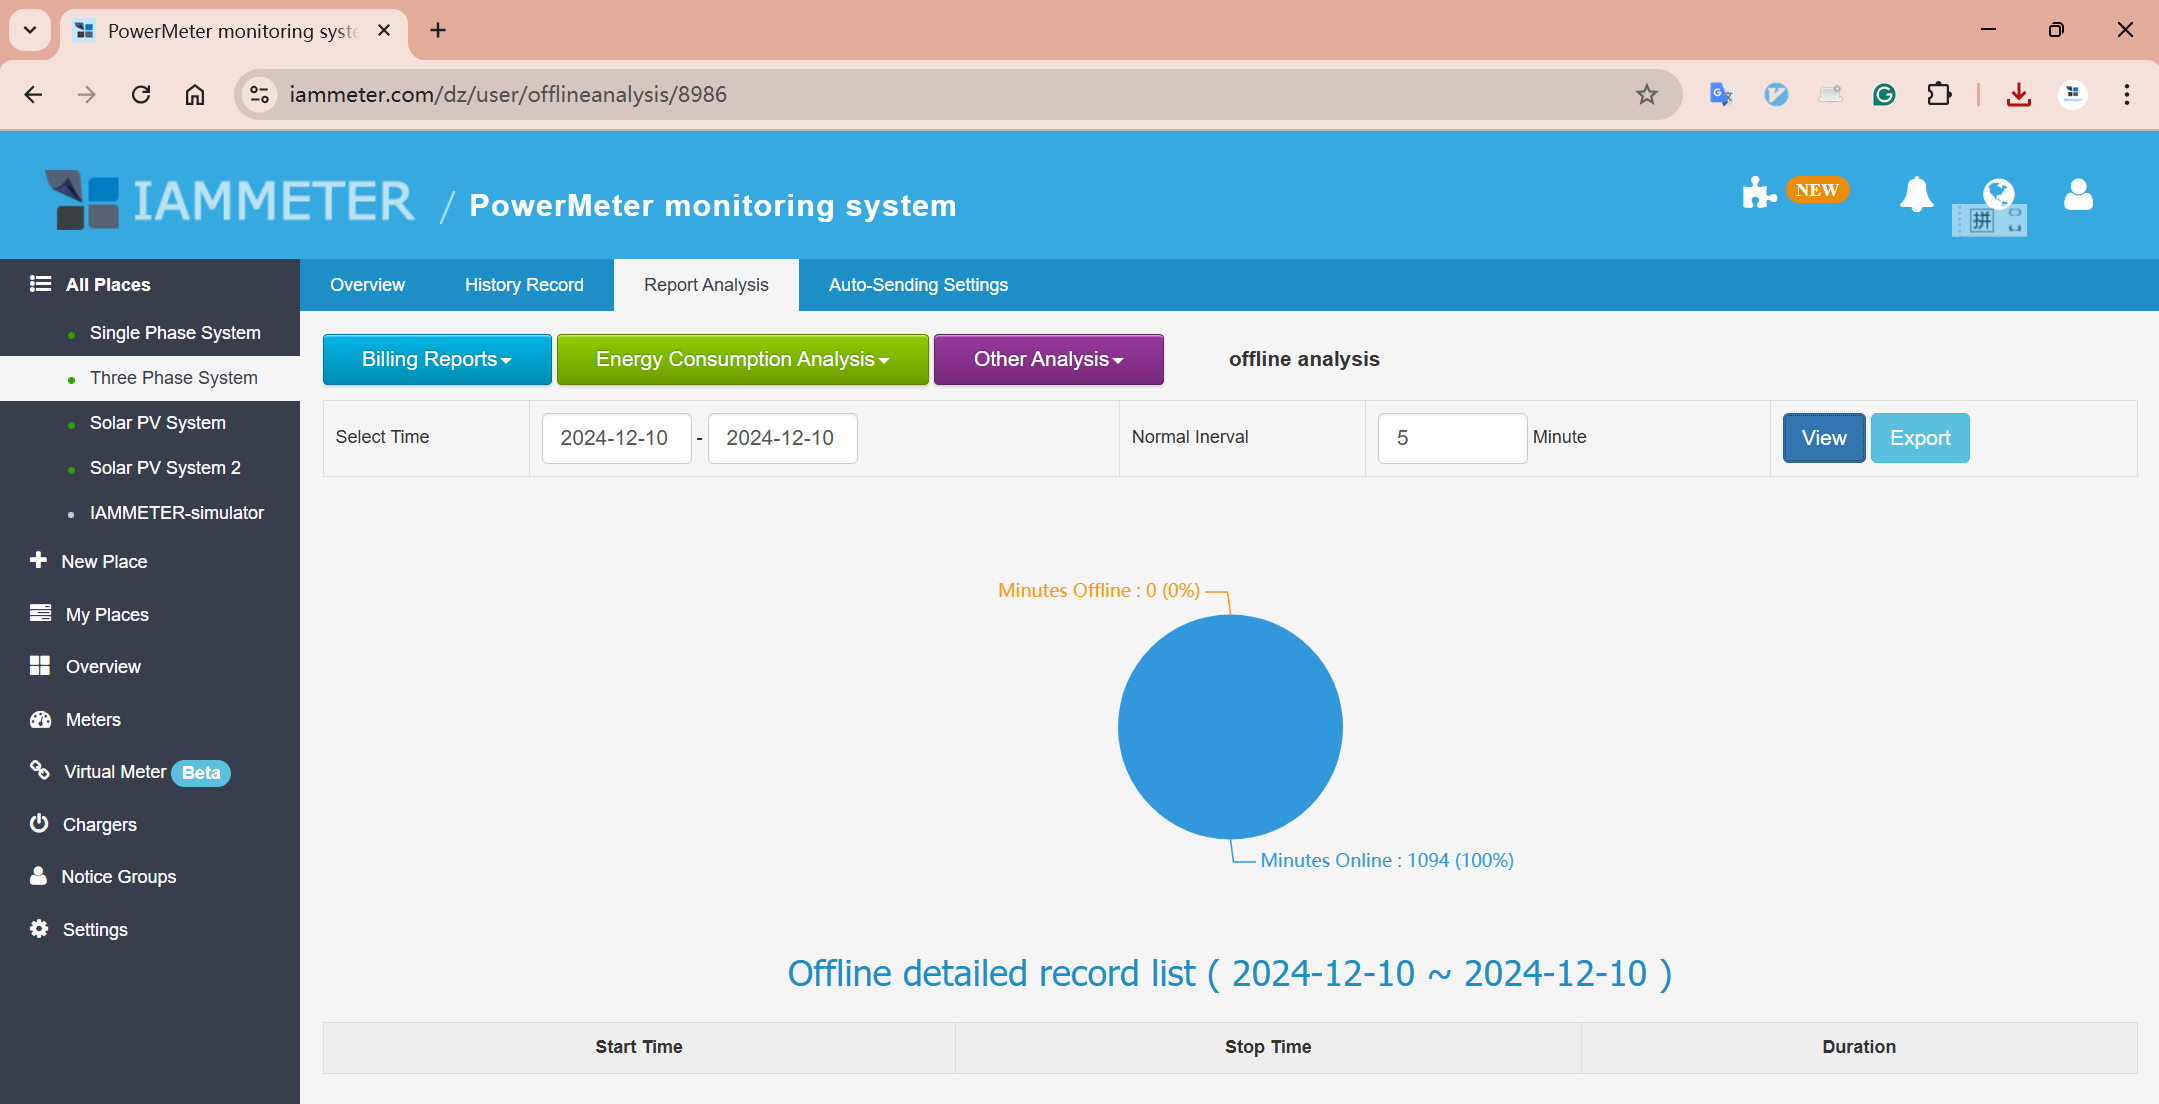
This report is designed to analyze the offline duration.
As shown below, with 5 minutes set as the standard for determining interruptions (an upload interval exceeding 5 minutes is considered an interruption), you can select a time range, and the report will count the number of interruptions and the duration during that period.
Three Phase Wi-Fi Energy Meter (WEM3080T)
Single Phase Wi-Fi Energy Meter (WEM3080)
Three Phase Wi-Fi Energy Meter (WEM3046T)
Three Phase Wi-Fi Energy Meter (WEM3050T)