


Report: Predicting Benefits of Battery Storage Based on Actual Usage
Report: Predicting Benefits of Battery Storage Based on Actual Usage
The idea of this feature comes from this topic home battery simulation
This report can help you assess the benefits of introducing a battery storage system based on your actual electricity usage.
You can also adjust different battery parameters and charging/discharging strategies to compare the differences in benefits.
Foreword
If you are considering purchasing a storage system because the feed-in tariffs for photovoltaics are too low, or the difference between peak and off-peak electricity prices is substantial, then this new report can help you complete the assessment.
Report assessment results, using a photovoltaic site under the IAMMETER demo account as the data source.
Comparison of the benefits brought by different battery storage systems parameters
Battery Module Parameter Setting Page
This is an interesting attempt by the IAMMETER development team, where customers can customize an AC-coupled battery (capacity, maximum charging power, discharging power, SOC limits, etc.).
Based on the user's actual yearly electricity/grid consumption (grid consumption Kwh and exported energy Kwh) and the user-customized battery, IAMMETER generates a report that visually tells customers how much additional annual revenue can be gained by introducing this AC-coupled battery .
Working Principle
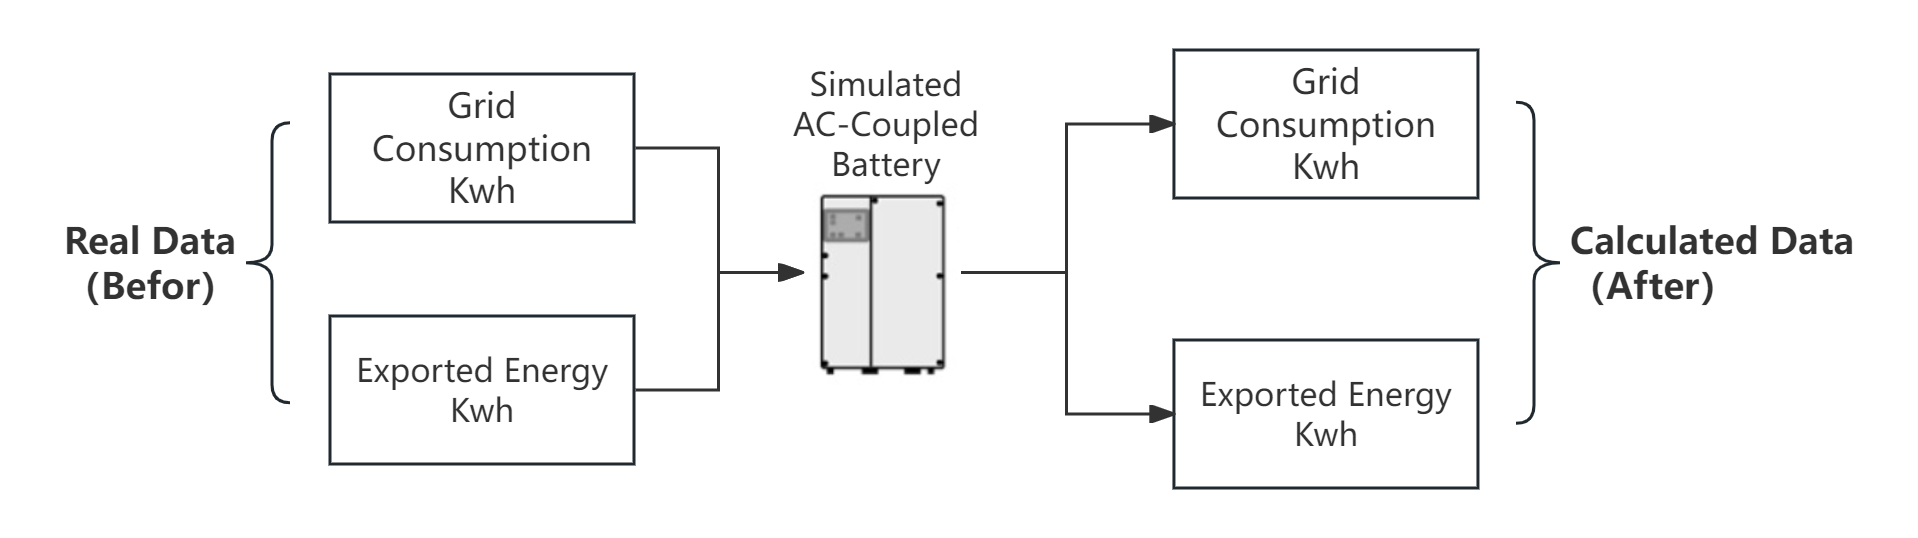
IAMMETER developed a simulated AC-coupled Battery model, which is the most interesting part of the entire functionality, although users do not need to pay attention to this part.
This simulated AC-coupled Battery can charge (increase SOC) and discharge (reduce SOC), and can set various parameters like a real AC-coupled Battery.
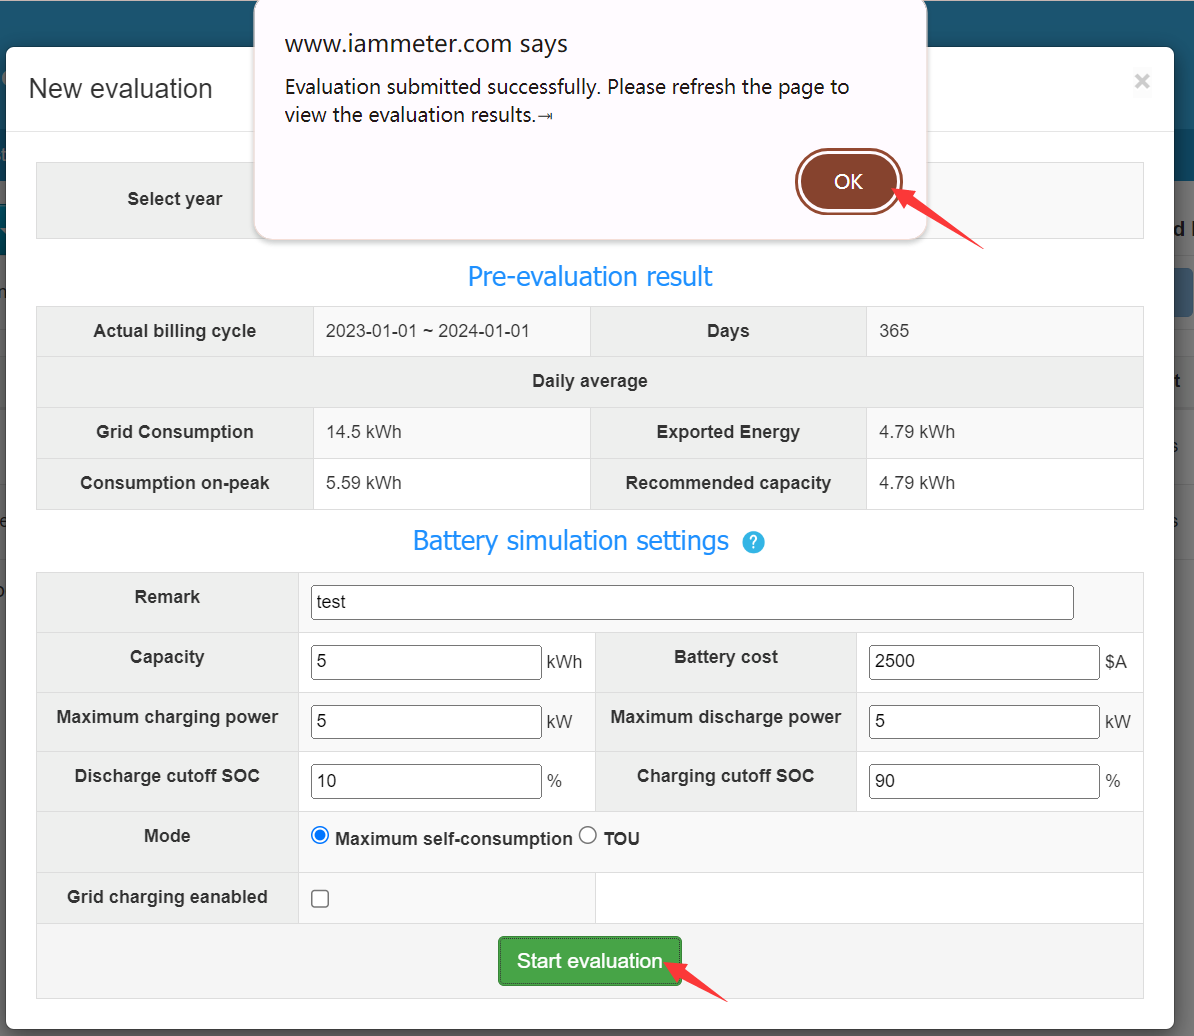
When users generate a new report, they only need to set the battery parameters and then click "Start evaluation".
IAMMETER configures the battery parameters to this simulated AC-coupled Battery, recalculates the original "Grid Consumption(before)" and "Exported Energy (before)" with the simulated AC-coupled Battery, thus obtaining two calculated "Grid Consumption (after)" and "Exported Energy (after)".
The system uses the calculated "Grid Consumption (after)" and "Exported Energy (after)" to calculate the bill and compare it with the previous bill.
Normally, the new bill will be cheaper, which is the benefit brought by introducing an AC-coupled Battery.
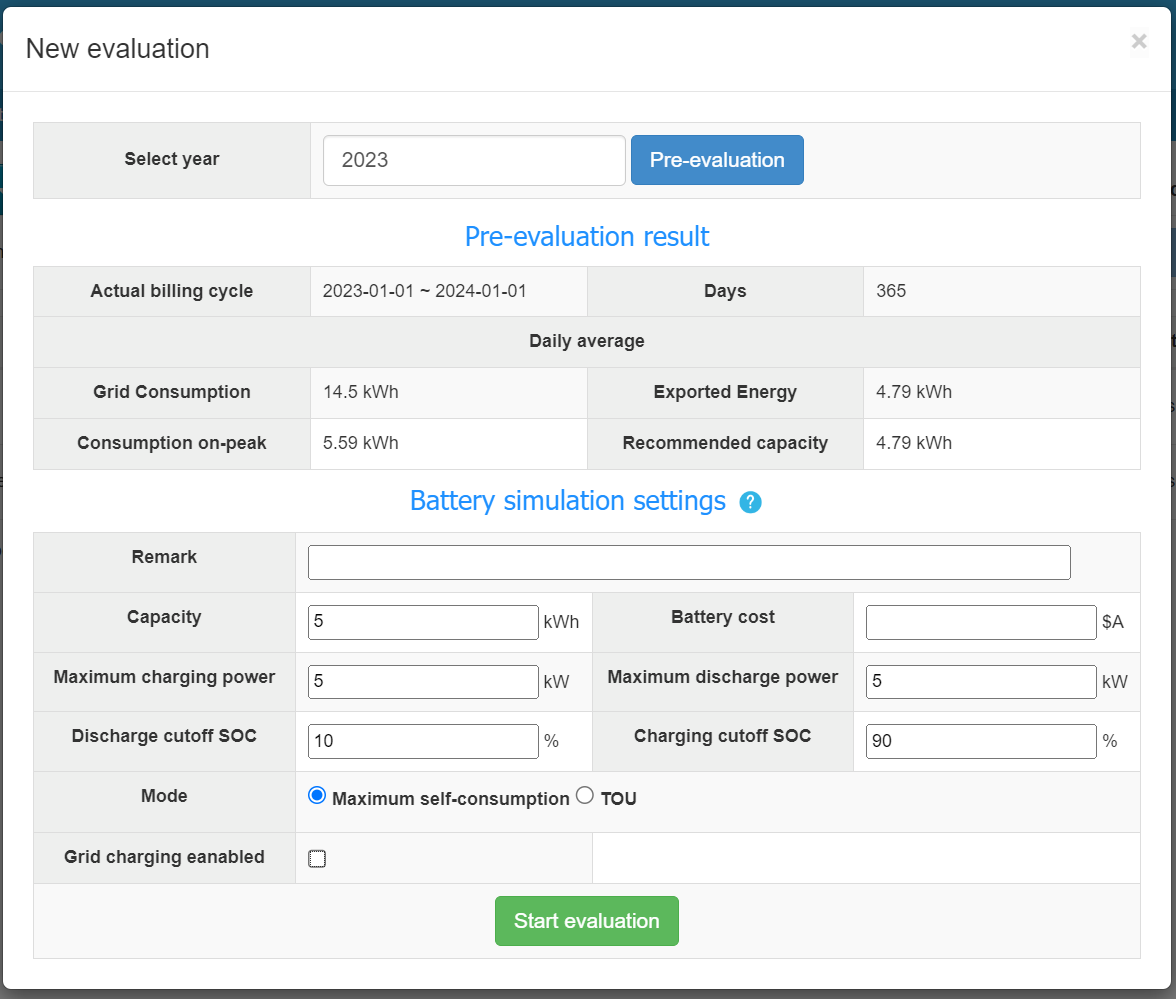
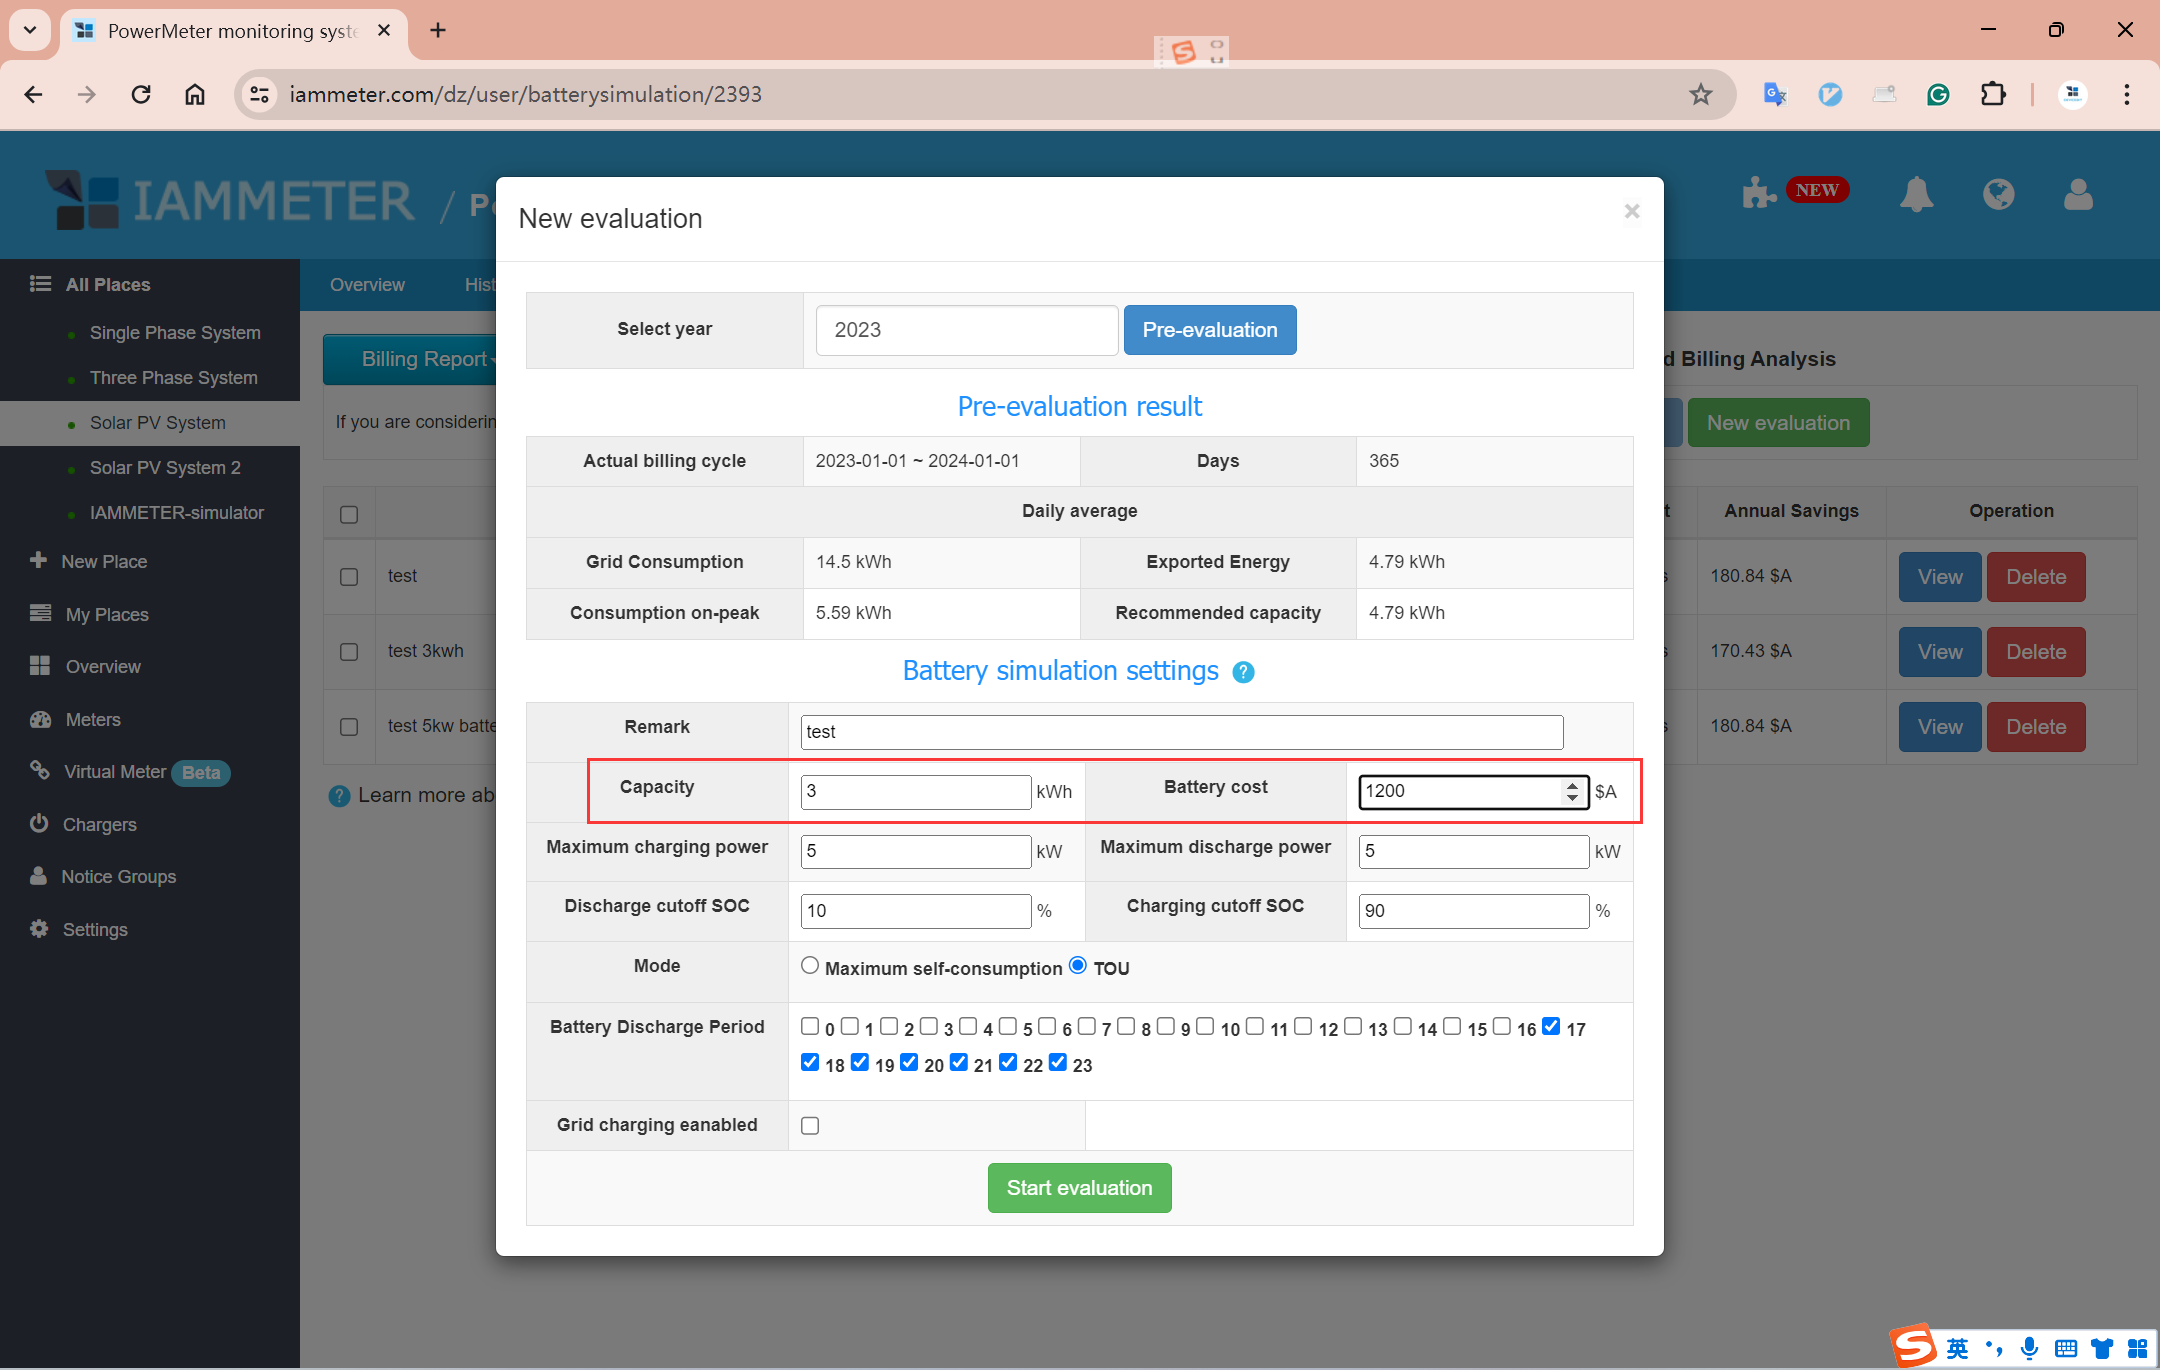
Battery Parameter Settings
"Remark": Name this report
“Capacity”: Battery capacity
“Battery Cost”: Price of the battery system (the final report will calculate the "Payback Period" based on this price)
“Maximum charging power”: Maximum charging power
“Maximum discharging power”: Maximum discharging power
“Discharge cutoff SOC”: Discharge cutoff SOC
“Charge cutoff SOC": Charge cutoff SOC
"Mode": Operating mode, currently providing "Maximum self-consumption" and "TOU" modes. The differences between these two modes will be introduced in specific setting examples later.
"Grid Charging Enabled": This option allows the battery to be charged using grid power. When activated, you should also specify the "Grid Charging Maximum Power" and the "Grid Charging Period" to manage the charging process effectively.
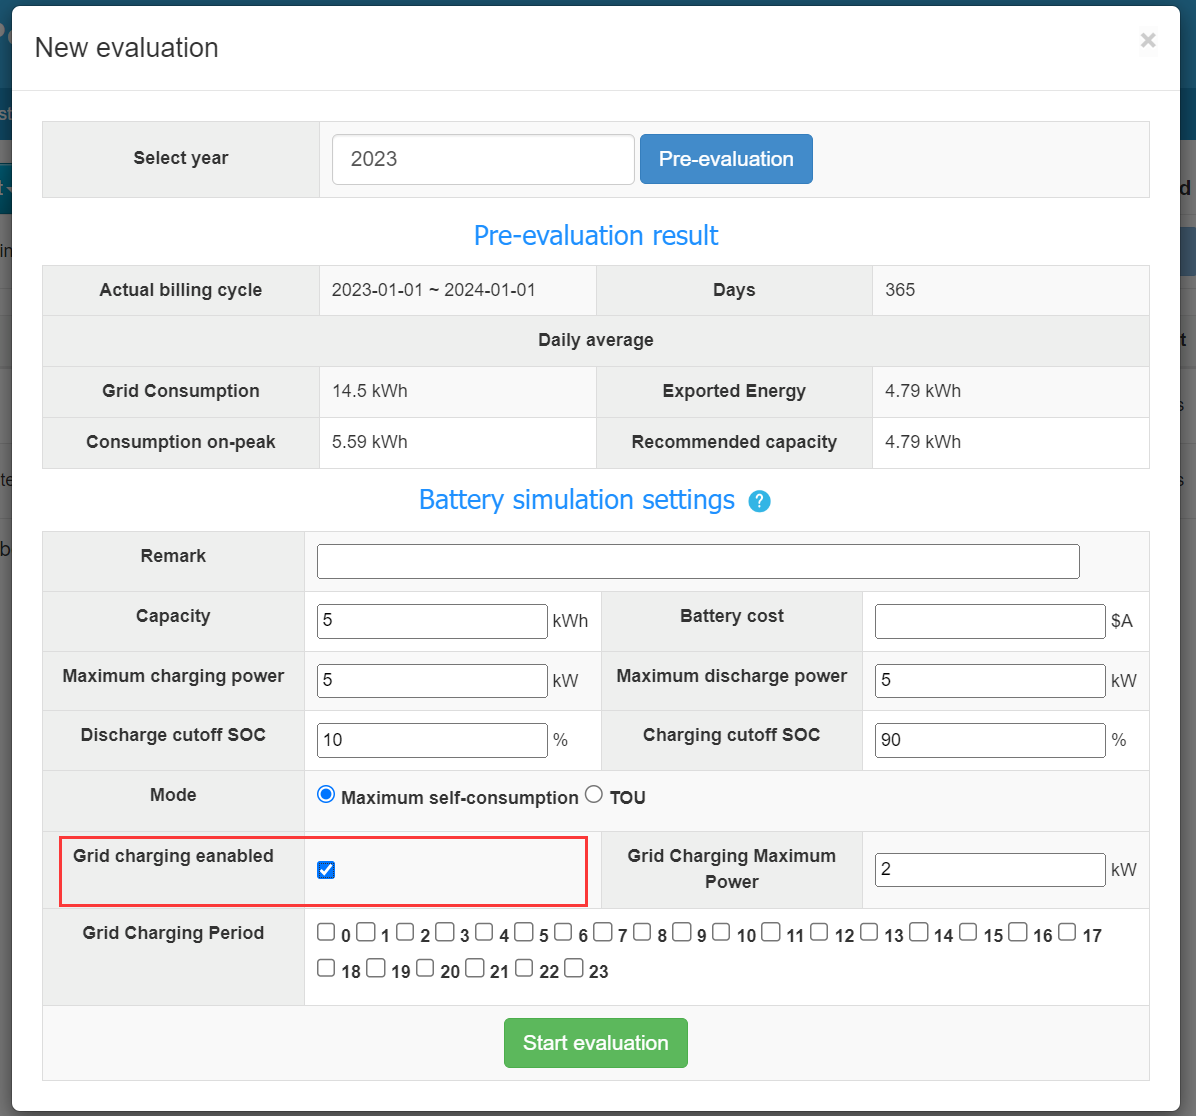
“Grid charging maximum power": Maximum grid charging power.
"Grid Charging Period ": Grid charging time selection, not selecting any means no grid charging allowed.
Example 1: Battery operating in “Maximum Self Consumption mode”
Maximum Self Consumption mode is a commonly used operating mode in battery storage systems. When there is excess electricity from photovoltaics, it prioritizes charging the battery for storage, aiming to minimize the amount of photovoltaic energy fed into the grid. When photovoltaics cannot meet the load demand, the battery discharges, minimizing the need for grid power supply. This maximizes the self-consumption rate of the photovoltaic system.
About “Maximum Self Consumption mode”
- The battery operates in Maximum Self Consumption mode.
- Does not restrict battery discharge time.
Specific Steps
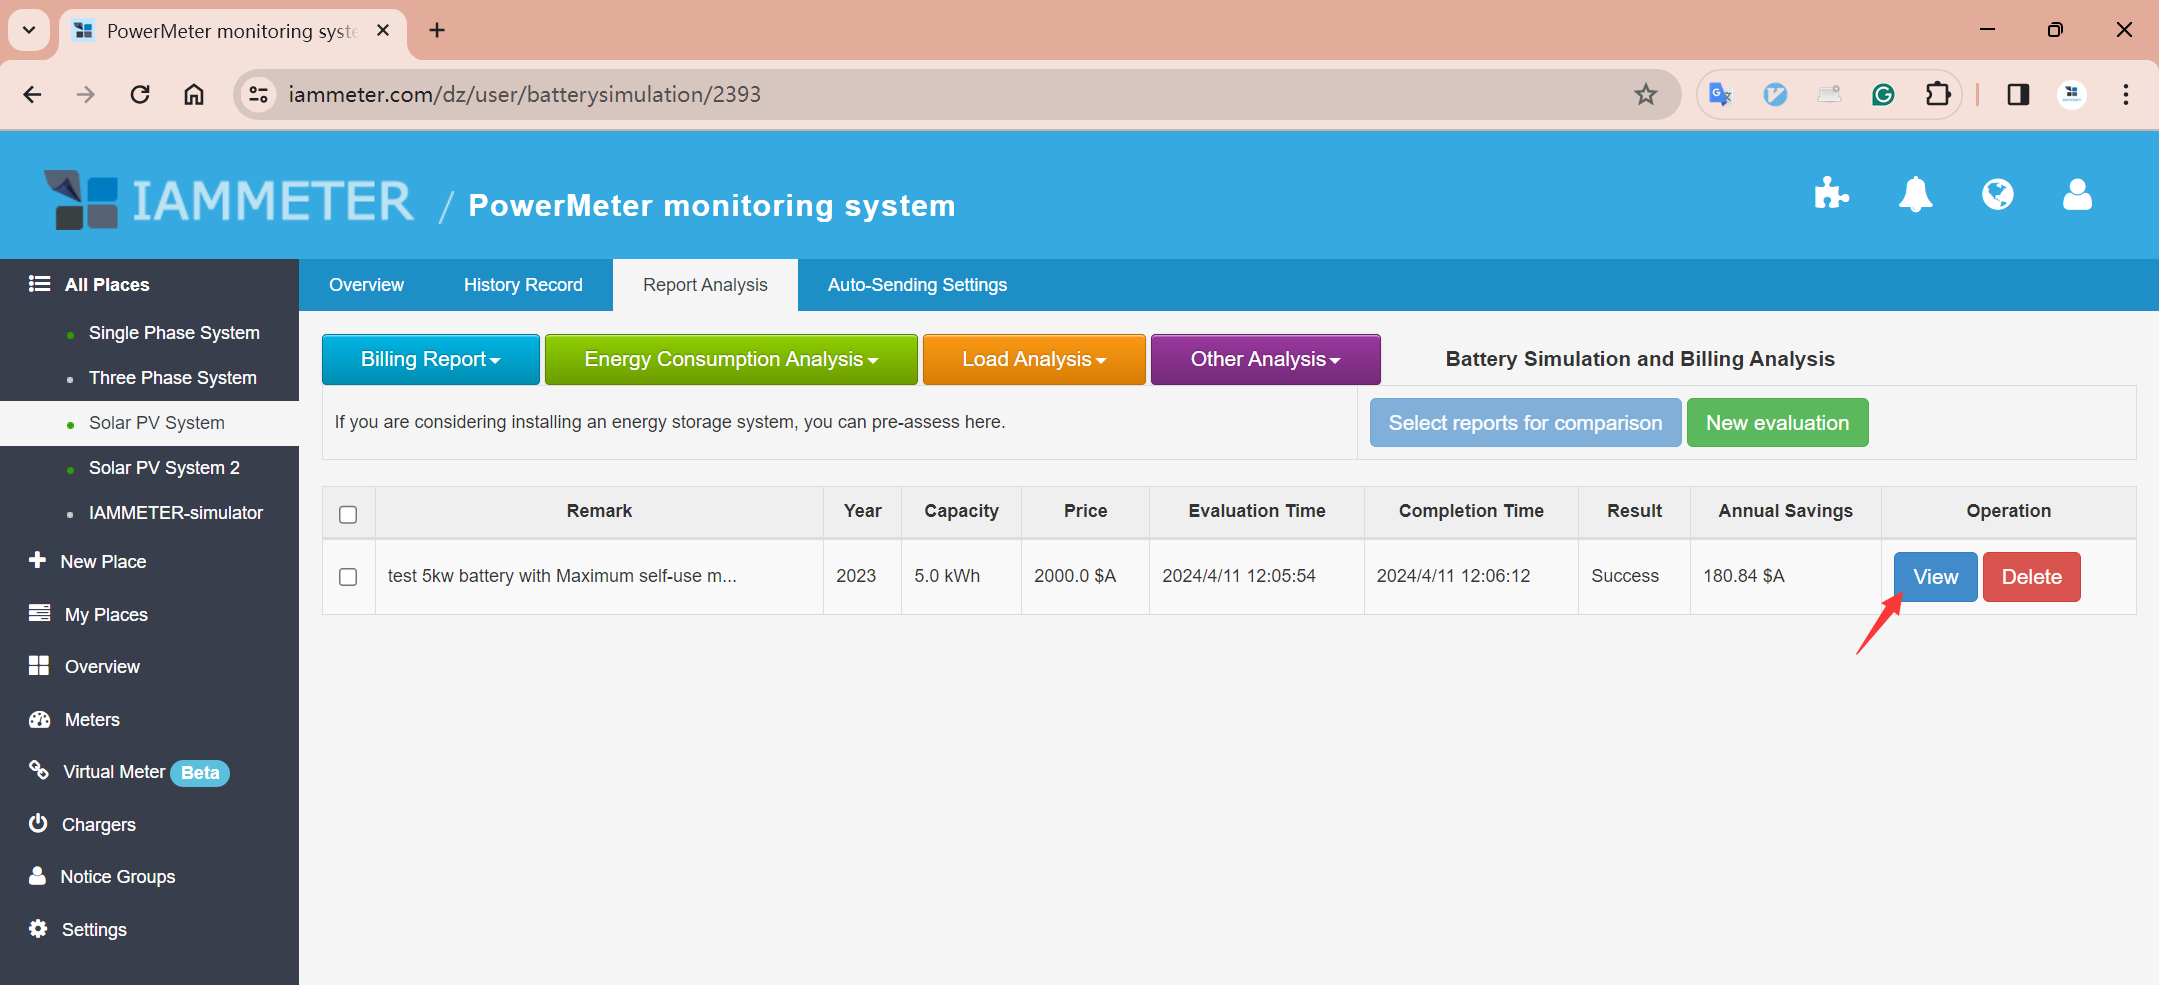
Enter the "Battery Simulation and Billing Analysis" report
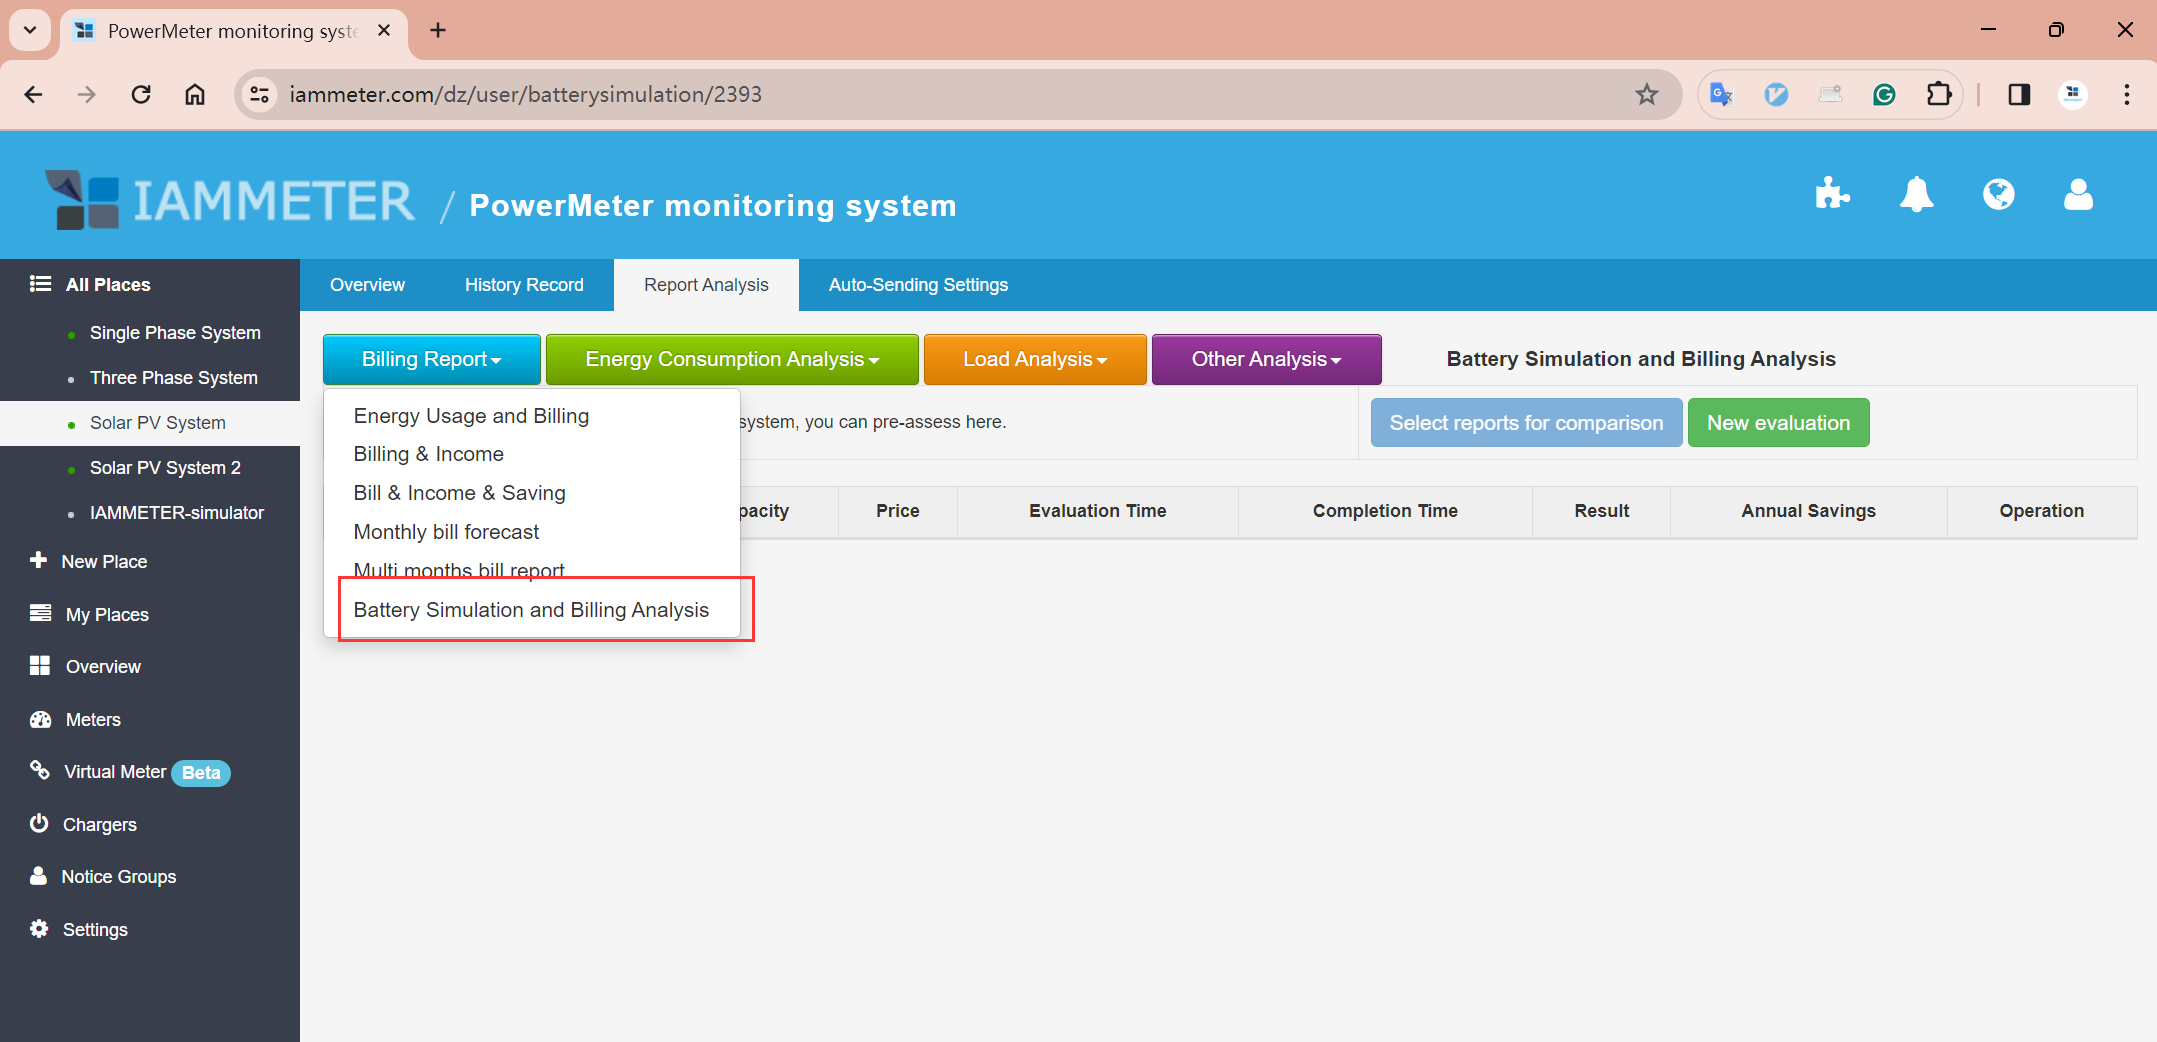
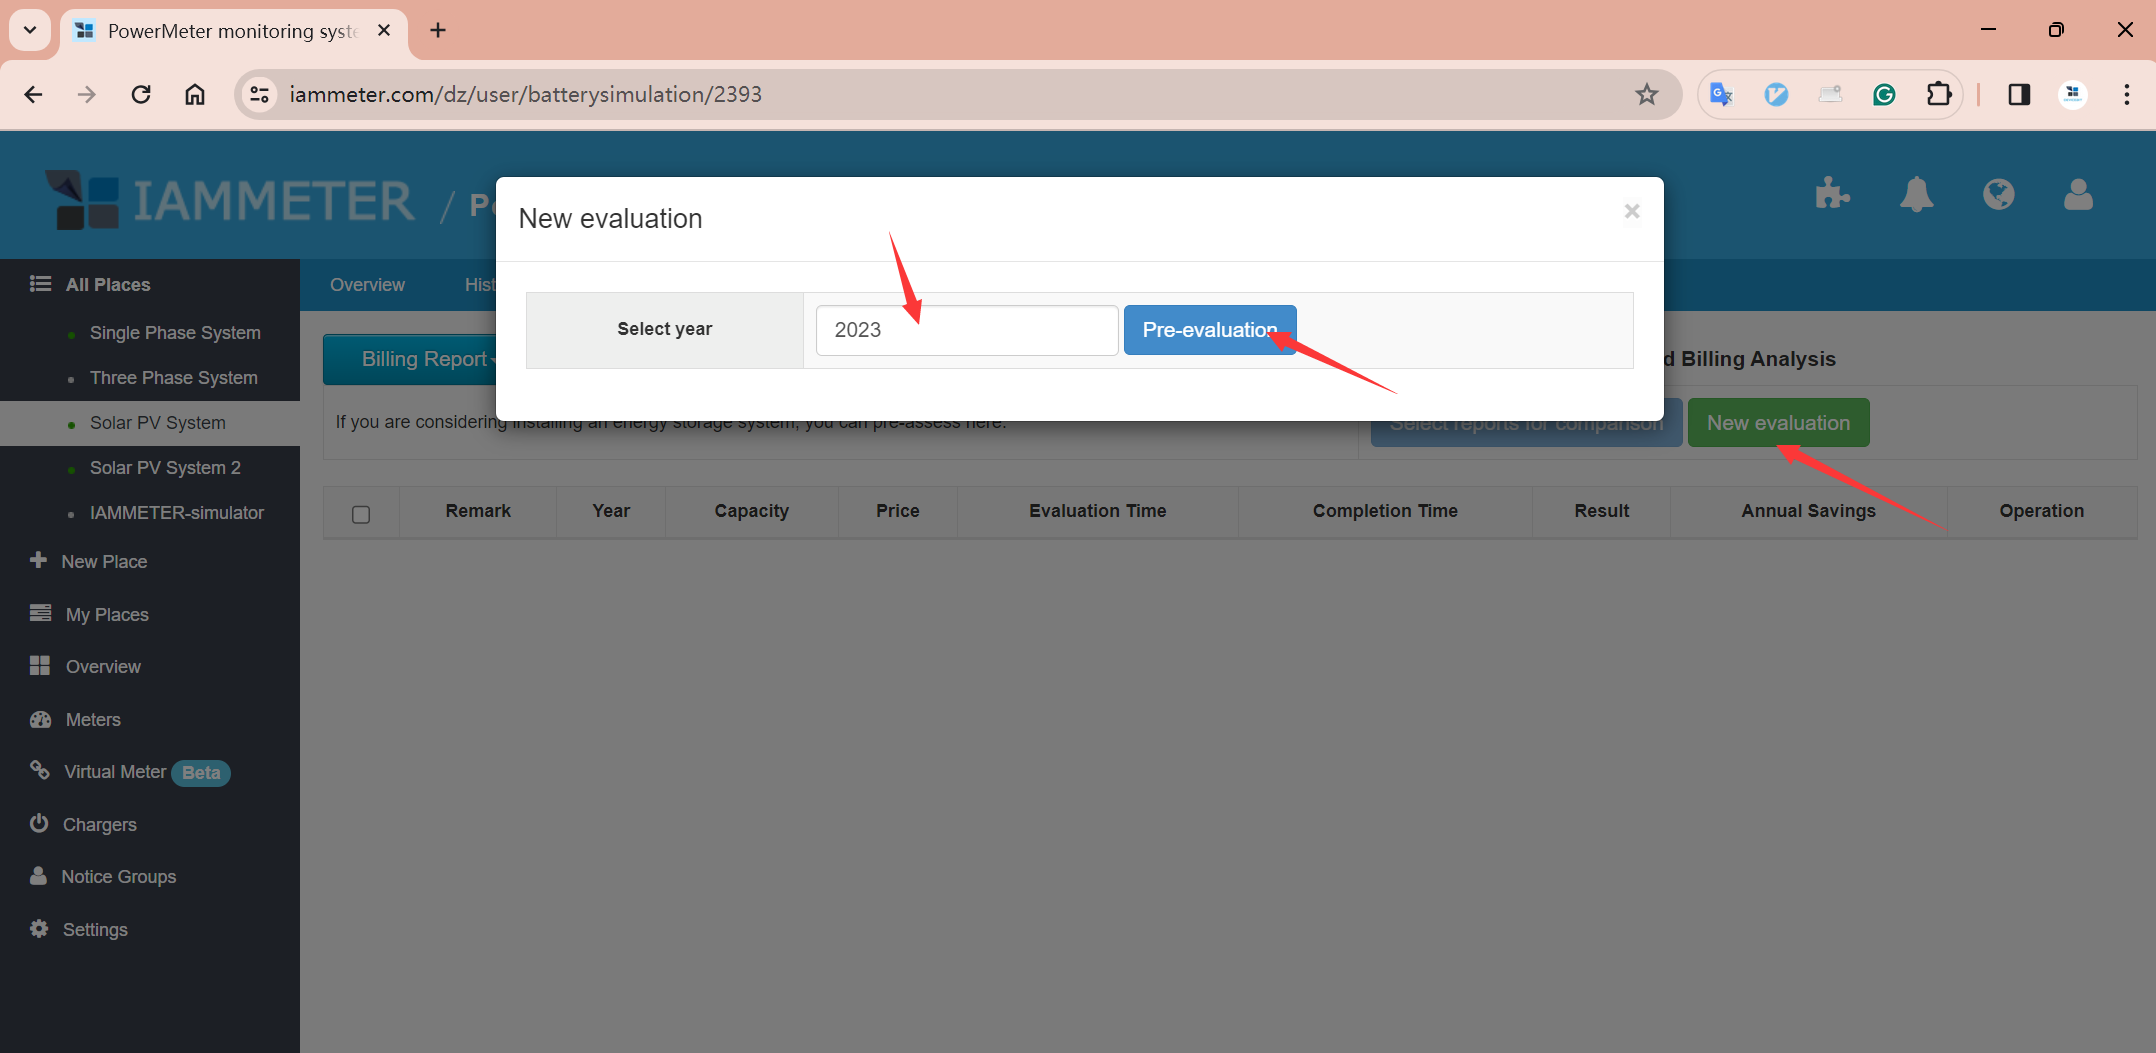
Click “New evaluation"
"Select year"
Click "Pre-evaluation"
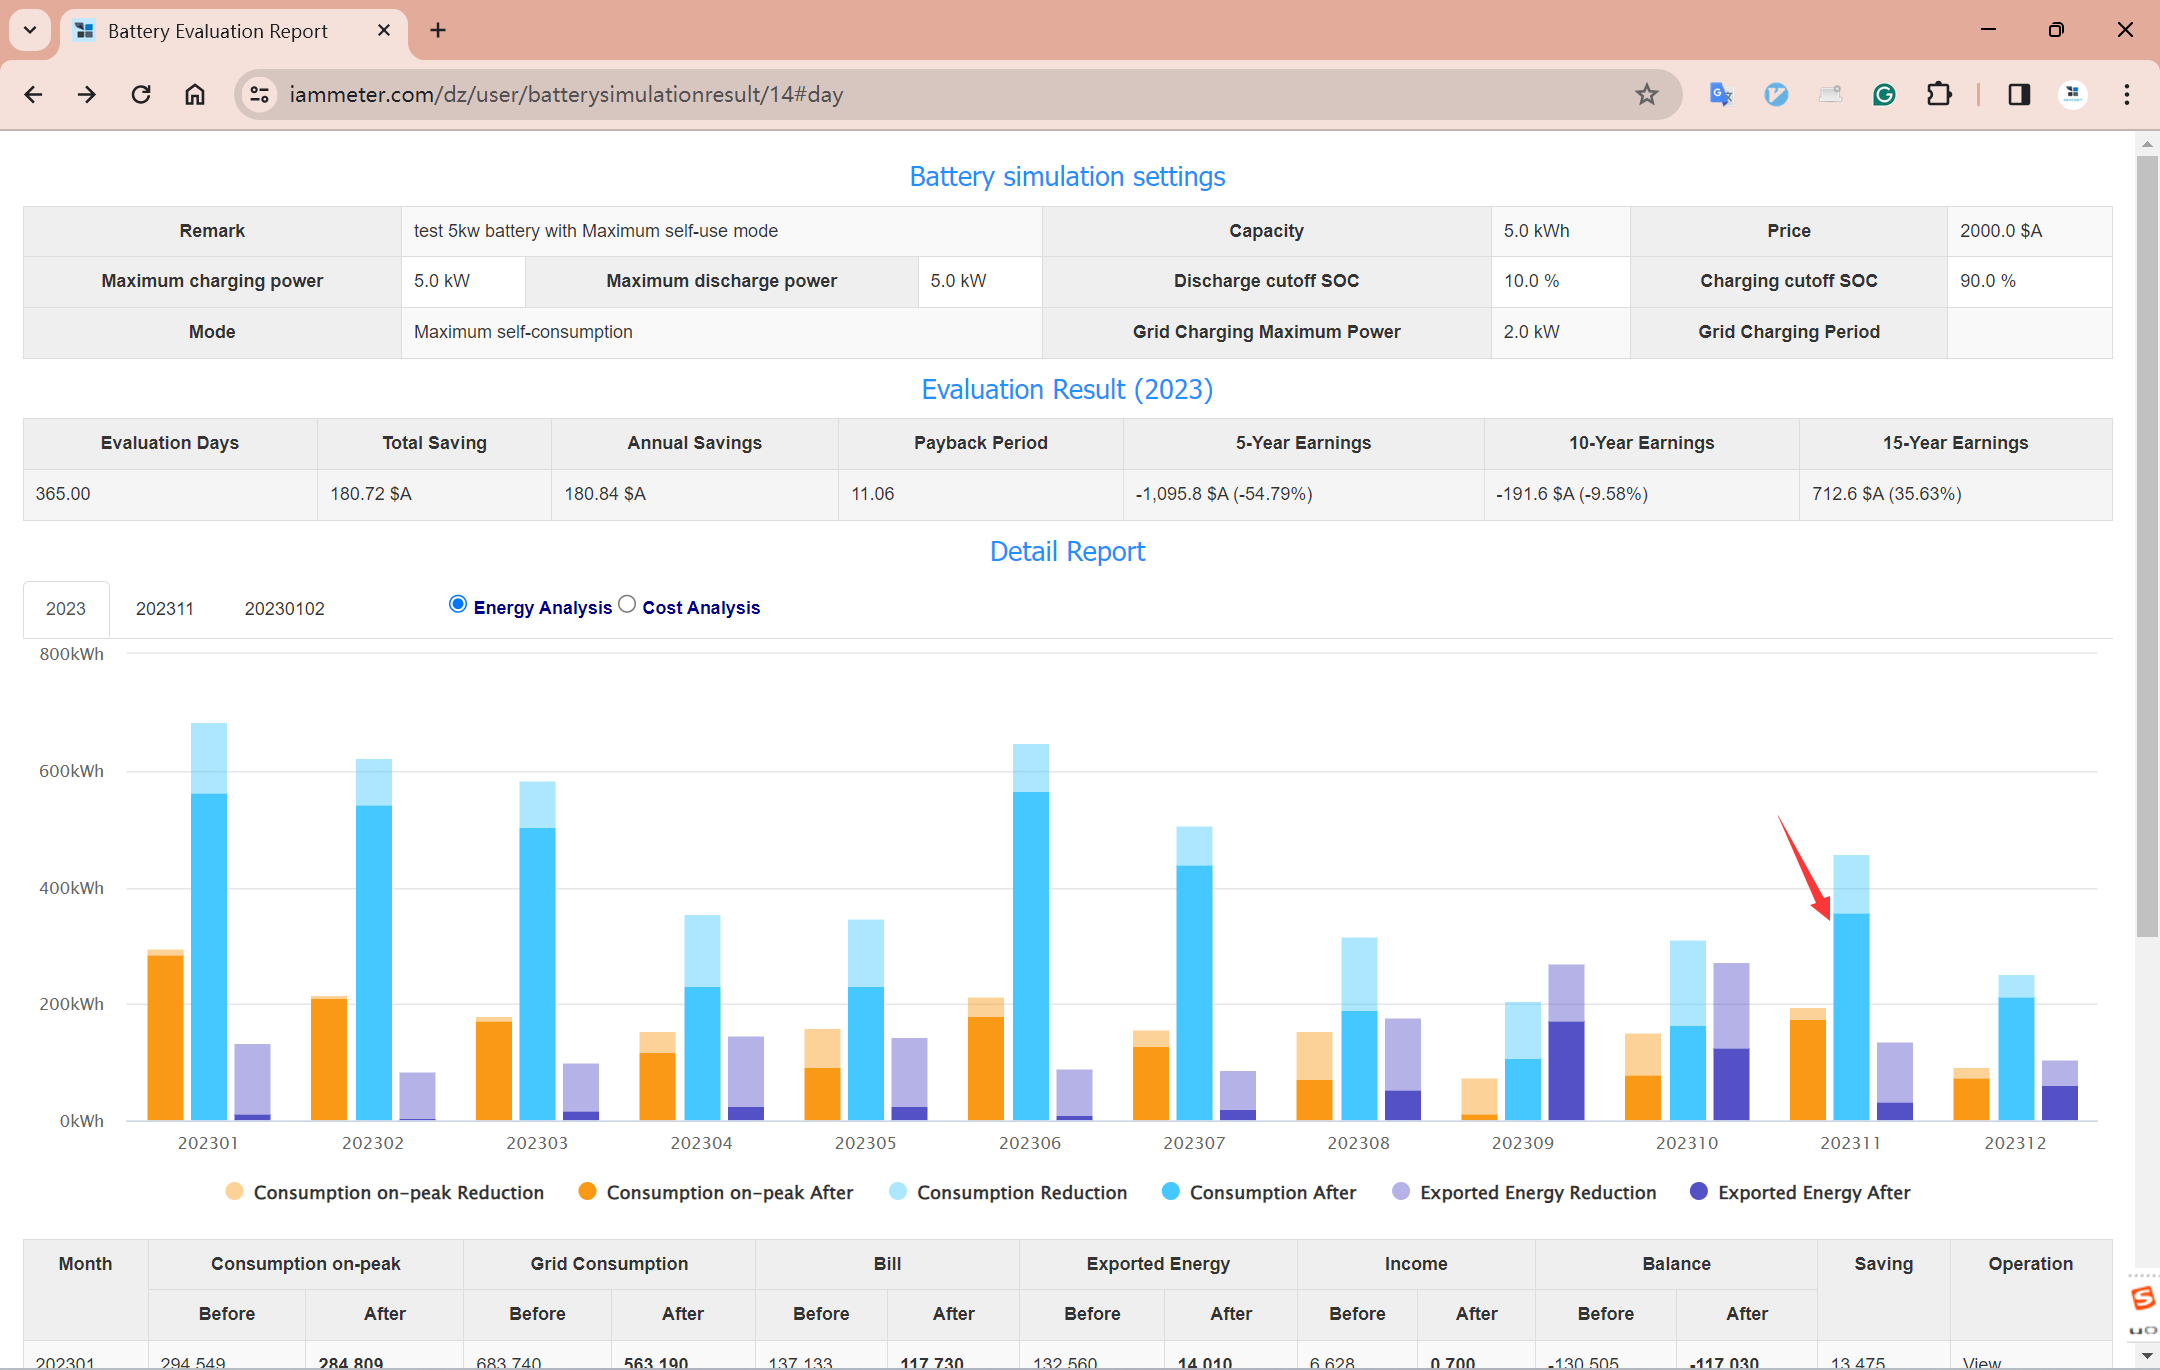
Configure the "Battery simulation setting"
Click "Start evaluation"
Click “View” to see the report content
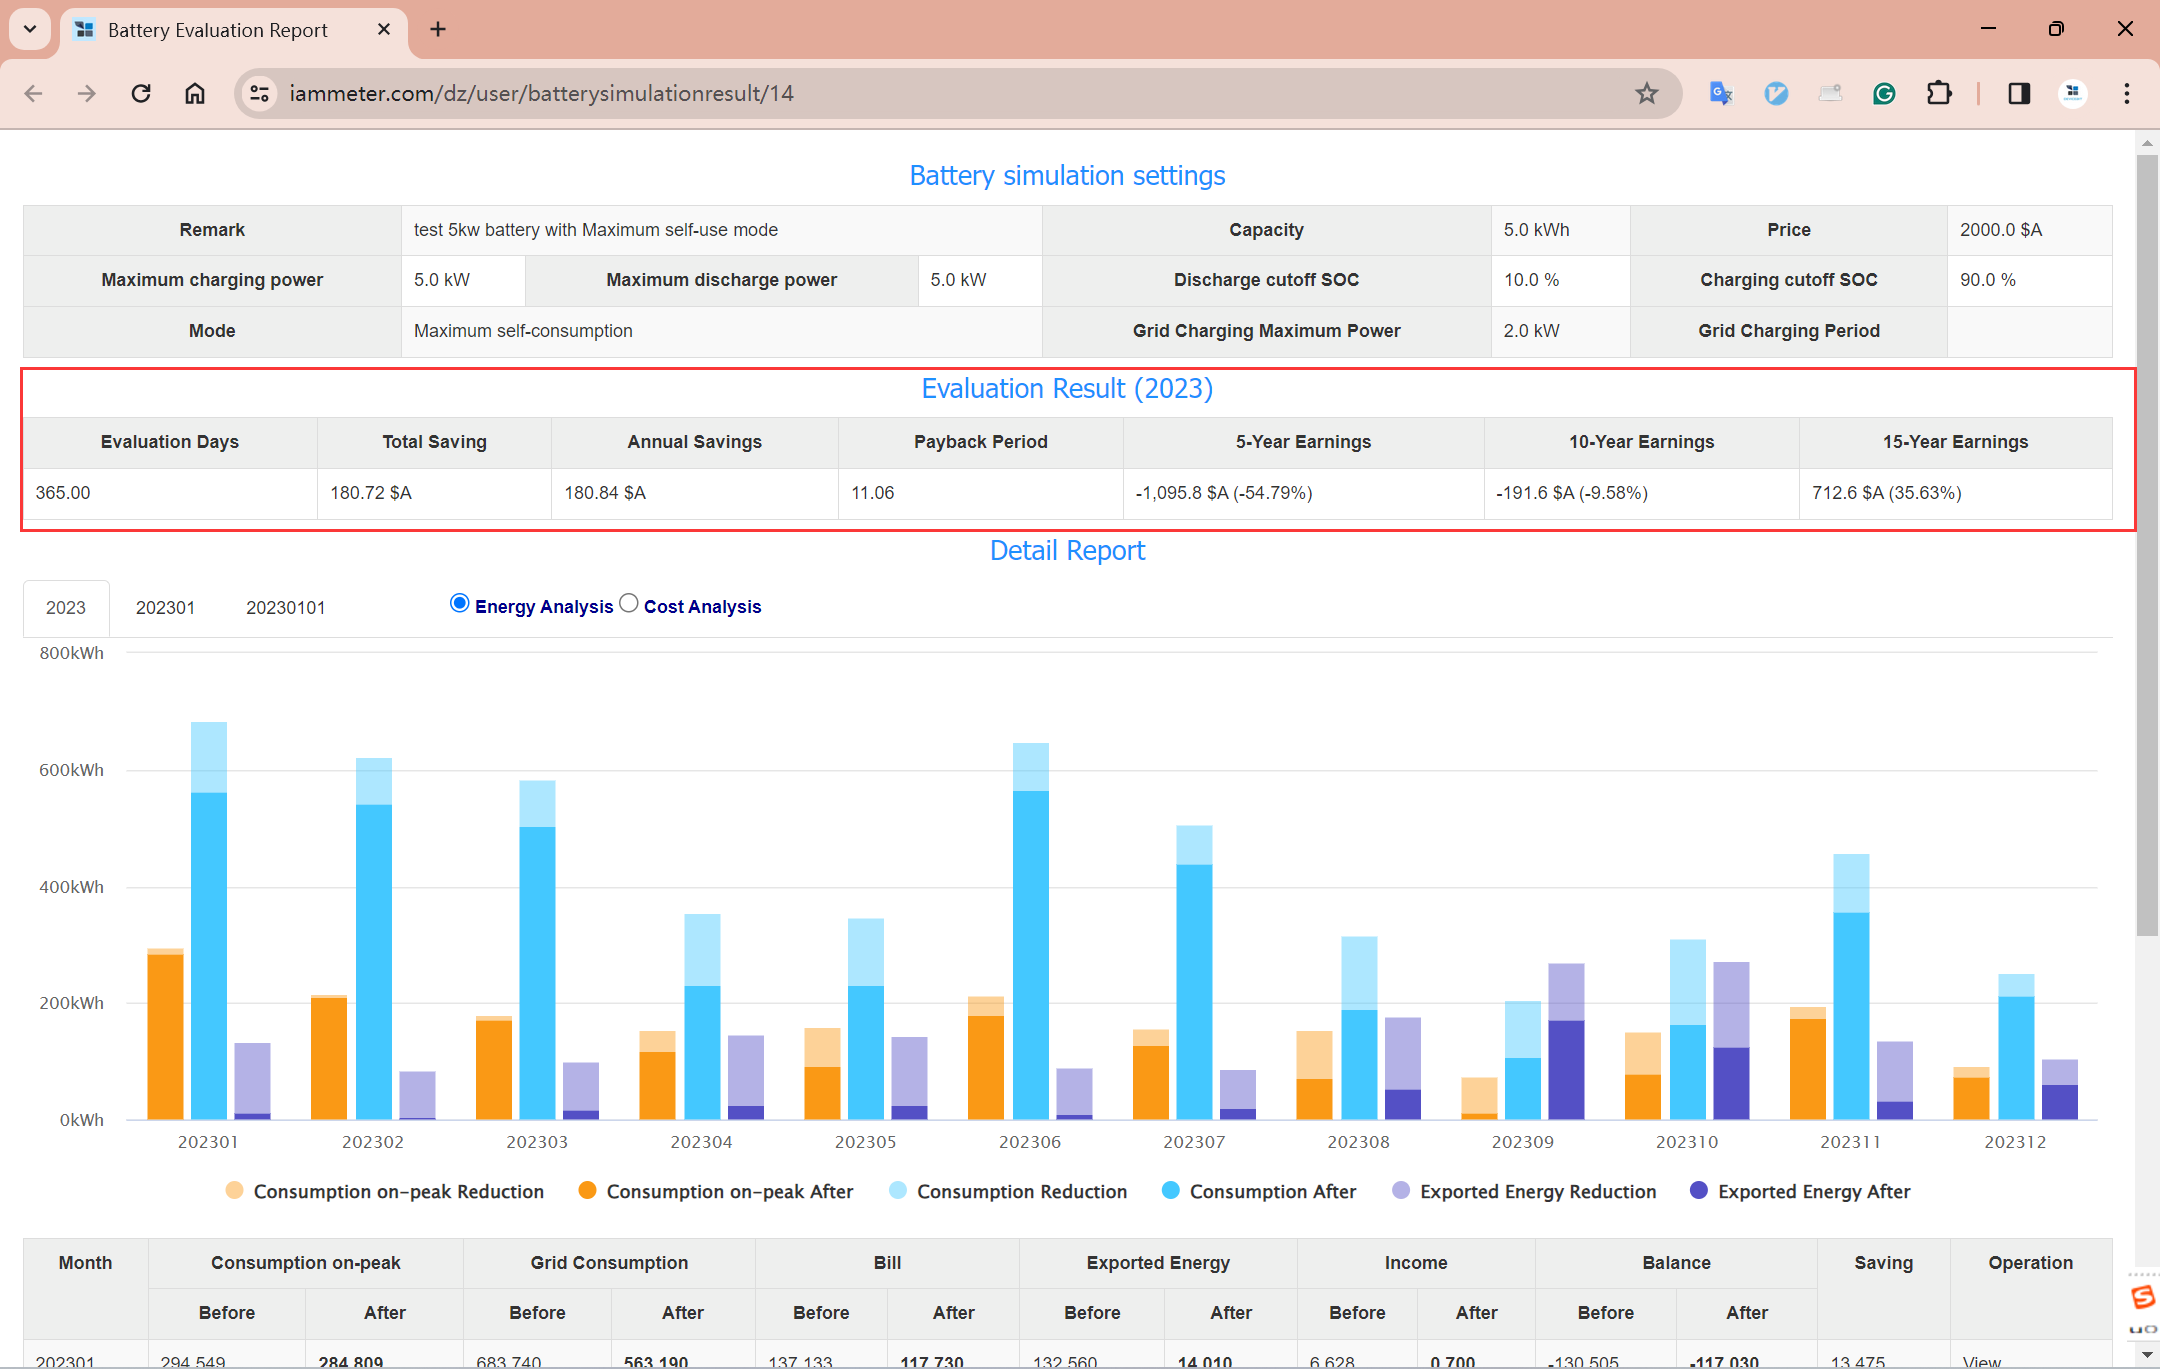
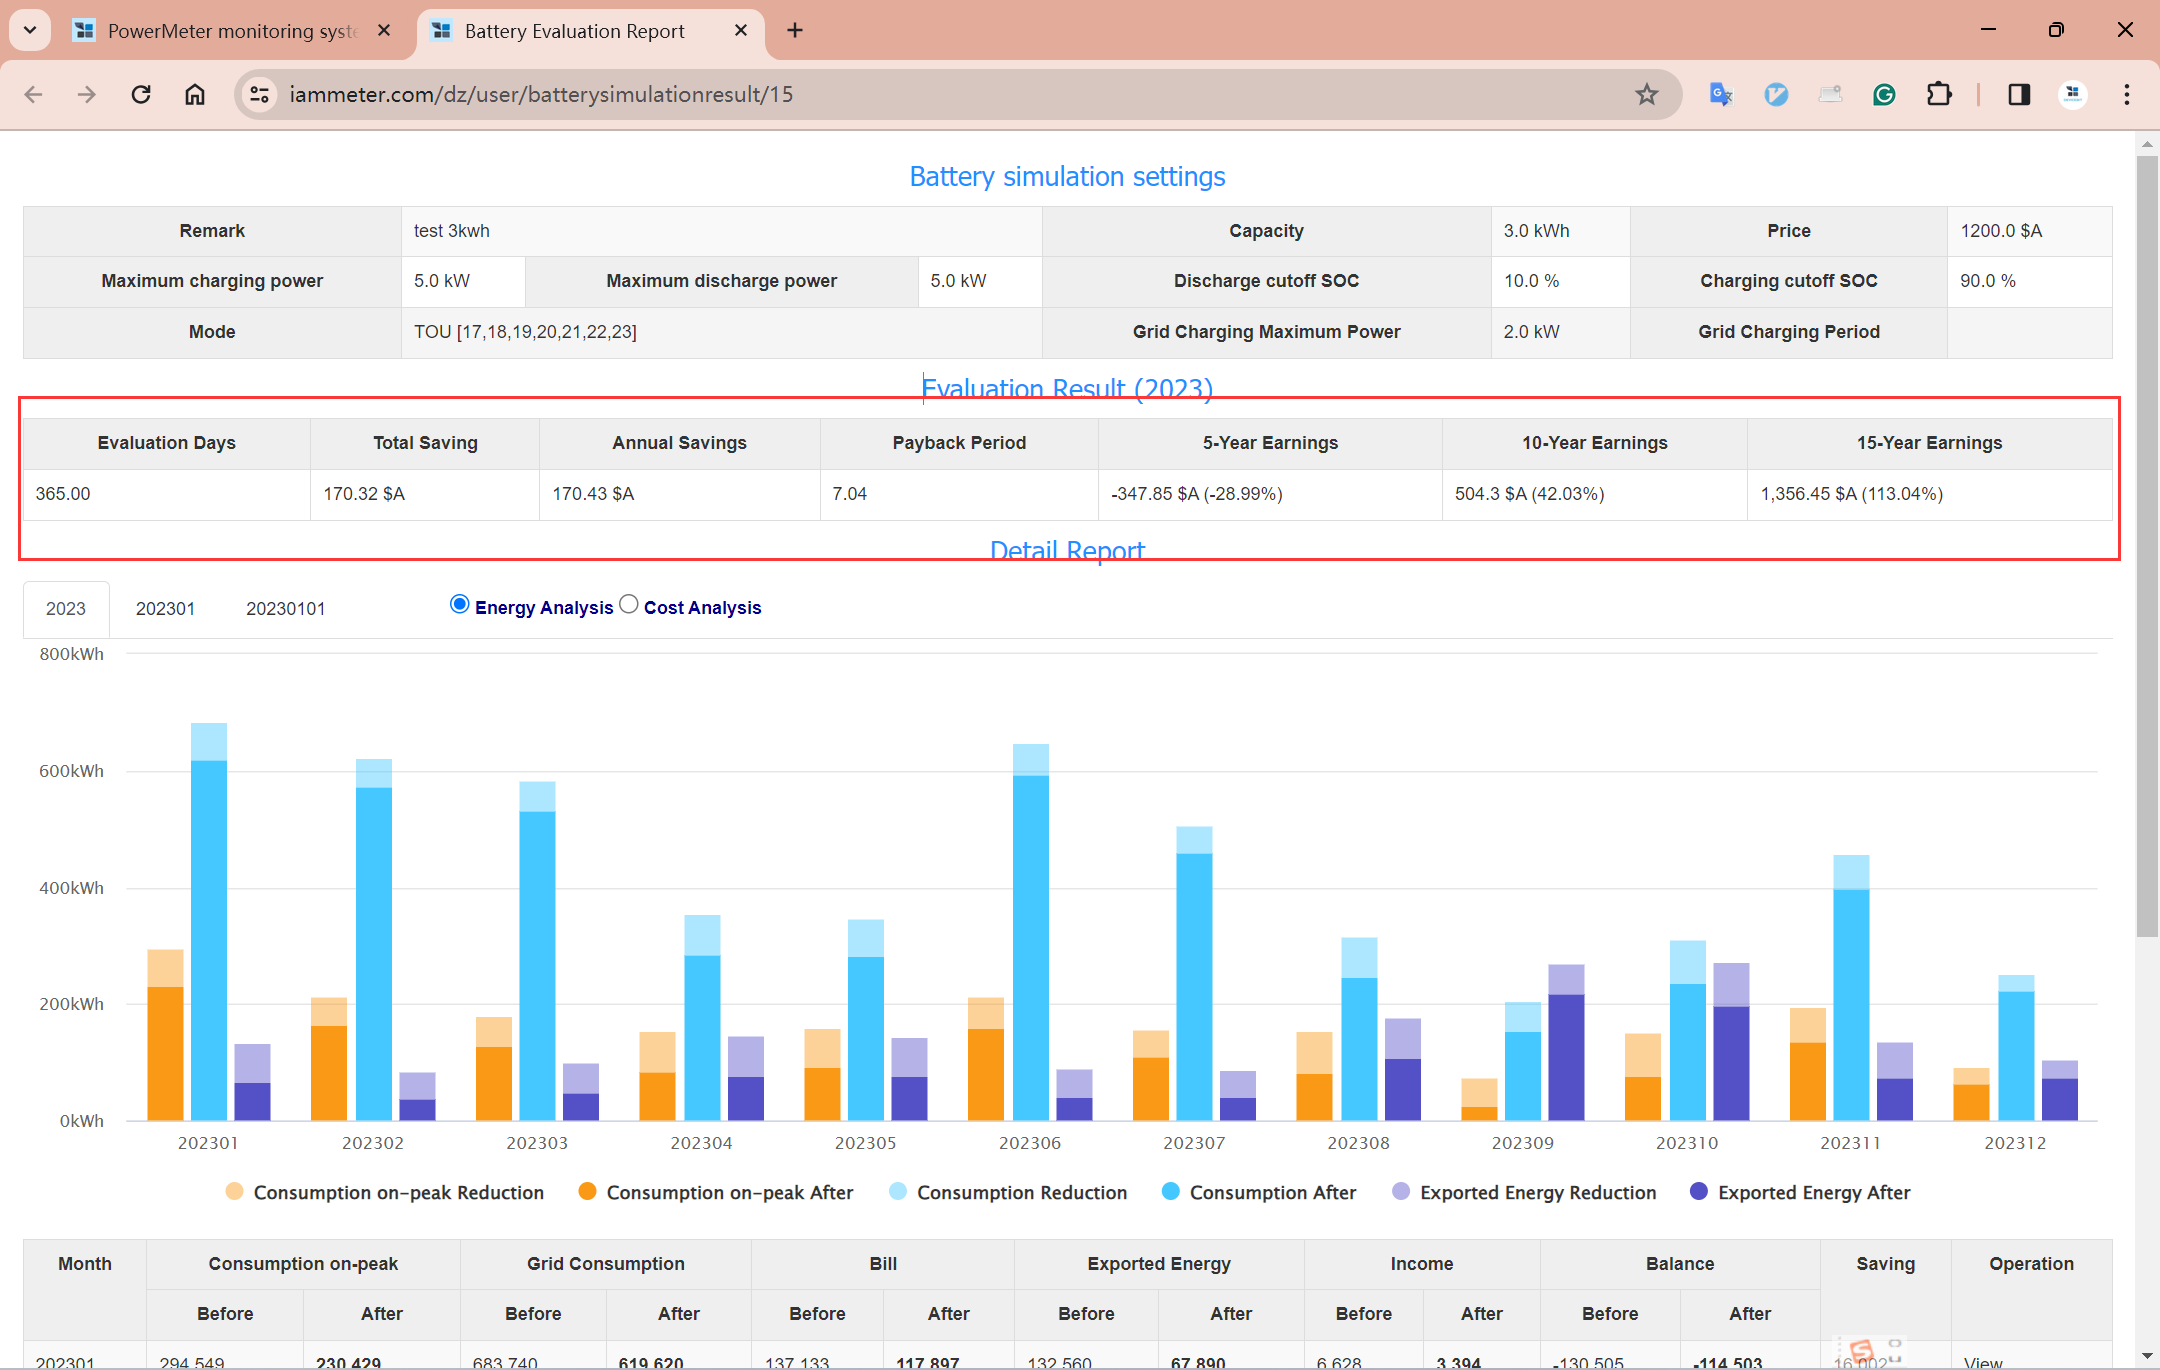
Report Content
"Total saving": Total money saved within the selected time range after introducing the battery.
"Annual saving": Money saved within the selected time range, quantified to a year. The difference between "Annual saving" and "Total saving" is, if the selected year is not a complete 365 days, such as only 300 days, then "Total saving" is the money saved in 300 days, while "Annual saving" is the money saved quantified to a year, in this example, "Annual saving"= 365*"Total saving"/300.
“Payback Period”: How many years it will take to recover the investment in this battery system, calculation formula: “Payback Period”=“Annual Savings”/“Price”
“5-Year Earnings”: Money the battery helps you earn in 5 years, calculation formula: “5-Year Earnings”= 5*"Annual Savings" - “Price"
“10-Year Earnings”: Money the battery helps you earn in 10 years, calculation formula: “10-Year Earnings”= 10*"Annual Savings" - “Price"
“15-Year Earnings”: Money the battery helps you earn in 15 years, calculation formula: “15-Year Earnings”= 15*"Annual Savings" - “Price"
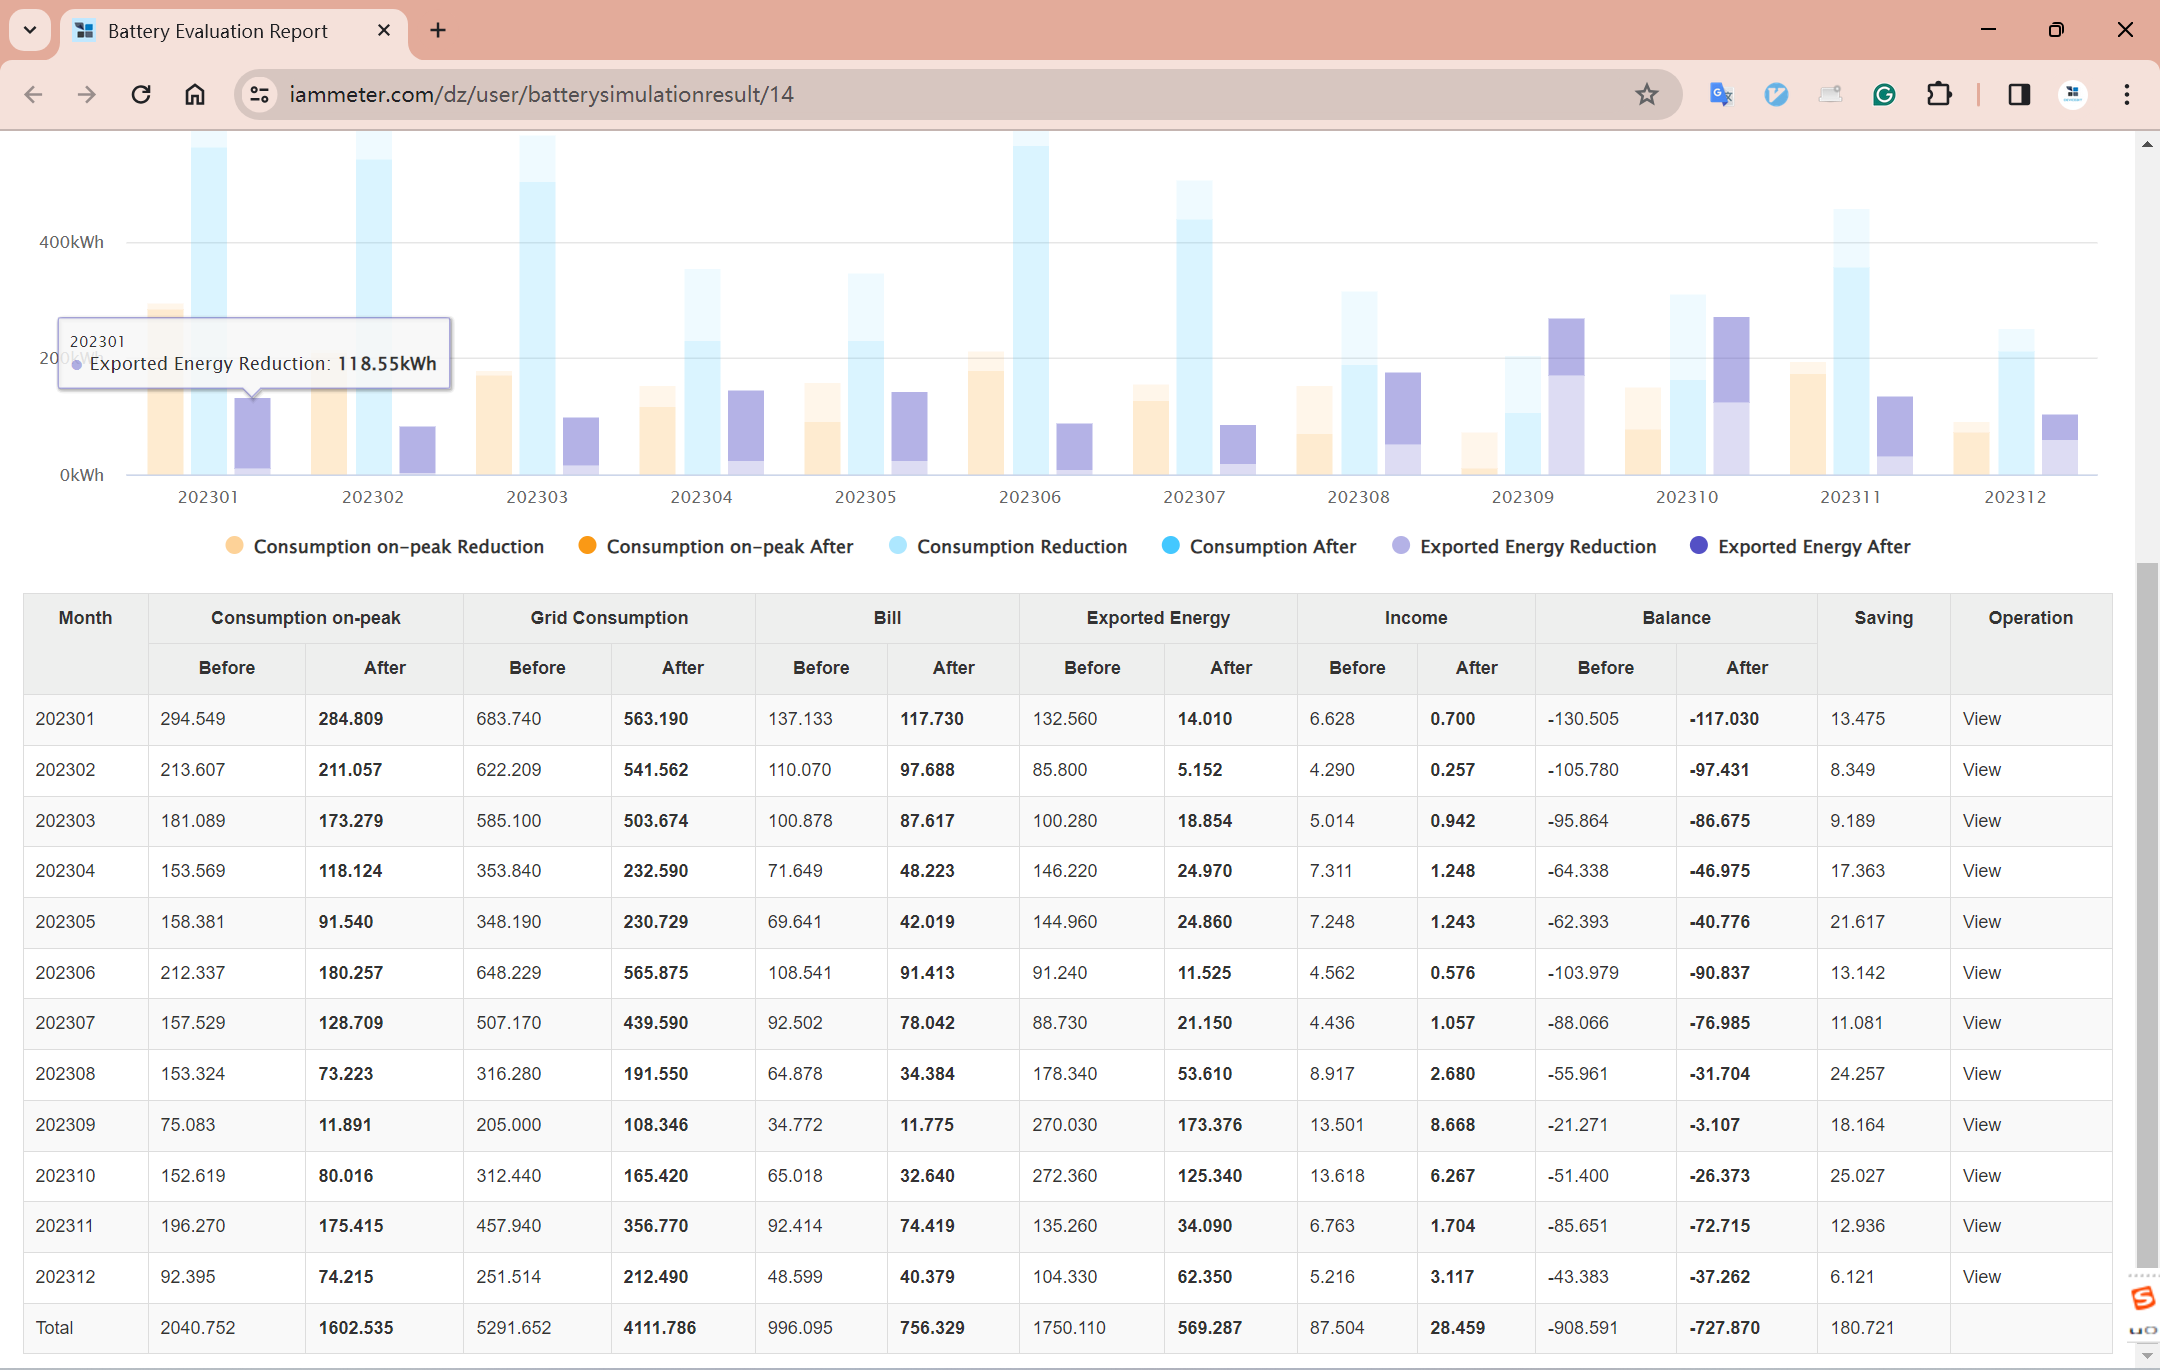
Consumption on-peak Reduction: Reduced Kwh during on-peak periods (because of the battery)
Consumption on-peak after: Kwh during on-peak periods after introducing the battery
Consumption Reduction: Reduced Kwh (because of the battery)
Consumption after: Kwh of consumption after introducing the battery
Exported Energy Reduction: Reduced Kwh fed into the grid (because of the battery)
Exported Energy After: Kwh of exported energy after introducing the battery
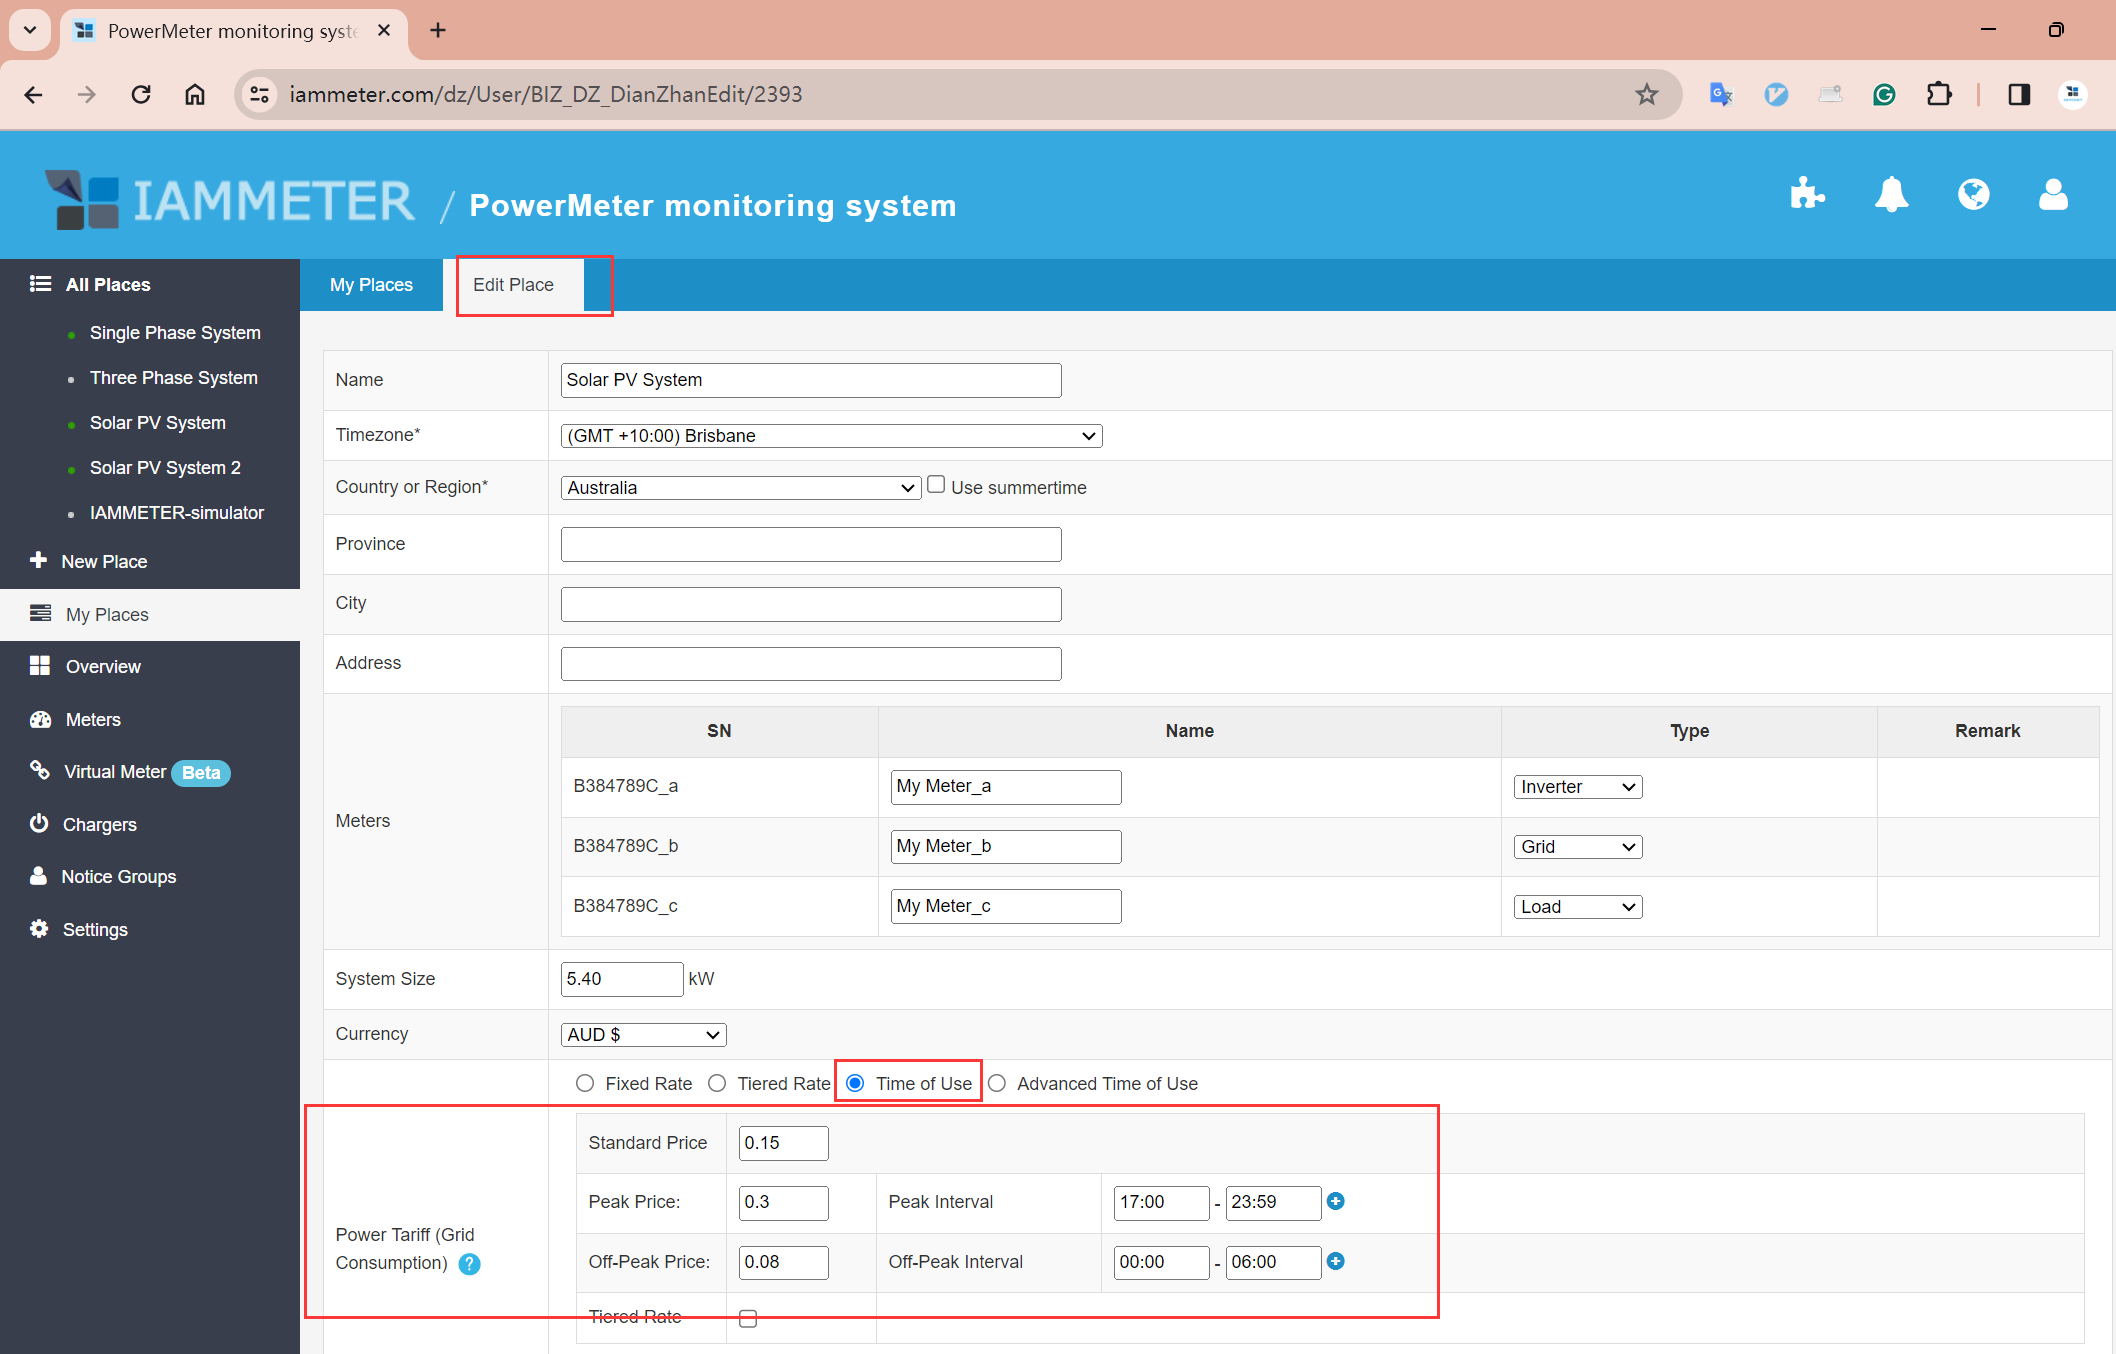
Please note: on-peak periods only appear after the electricity fee is set with a TOU template, please refer to Configure the Time-of-Use power tariff template.
You can see the "Grid Consumption " and "Exported Energy" on a monthly basis in the table.
"Before": Actual measured values (monthly)
"After": Calculated values (monthly).
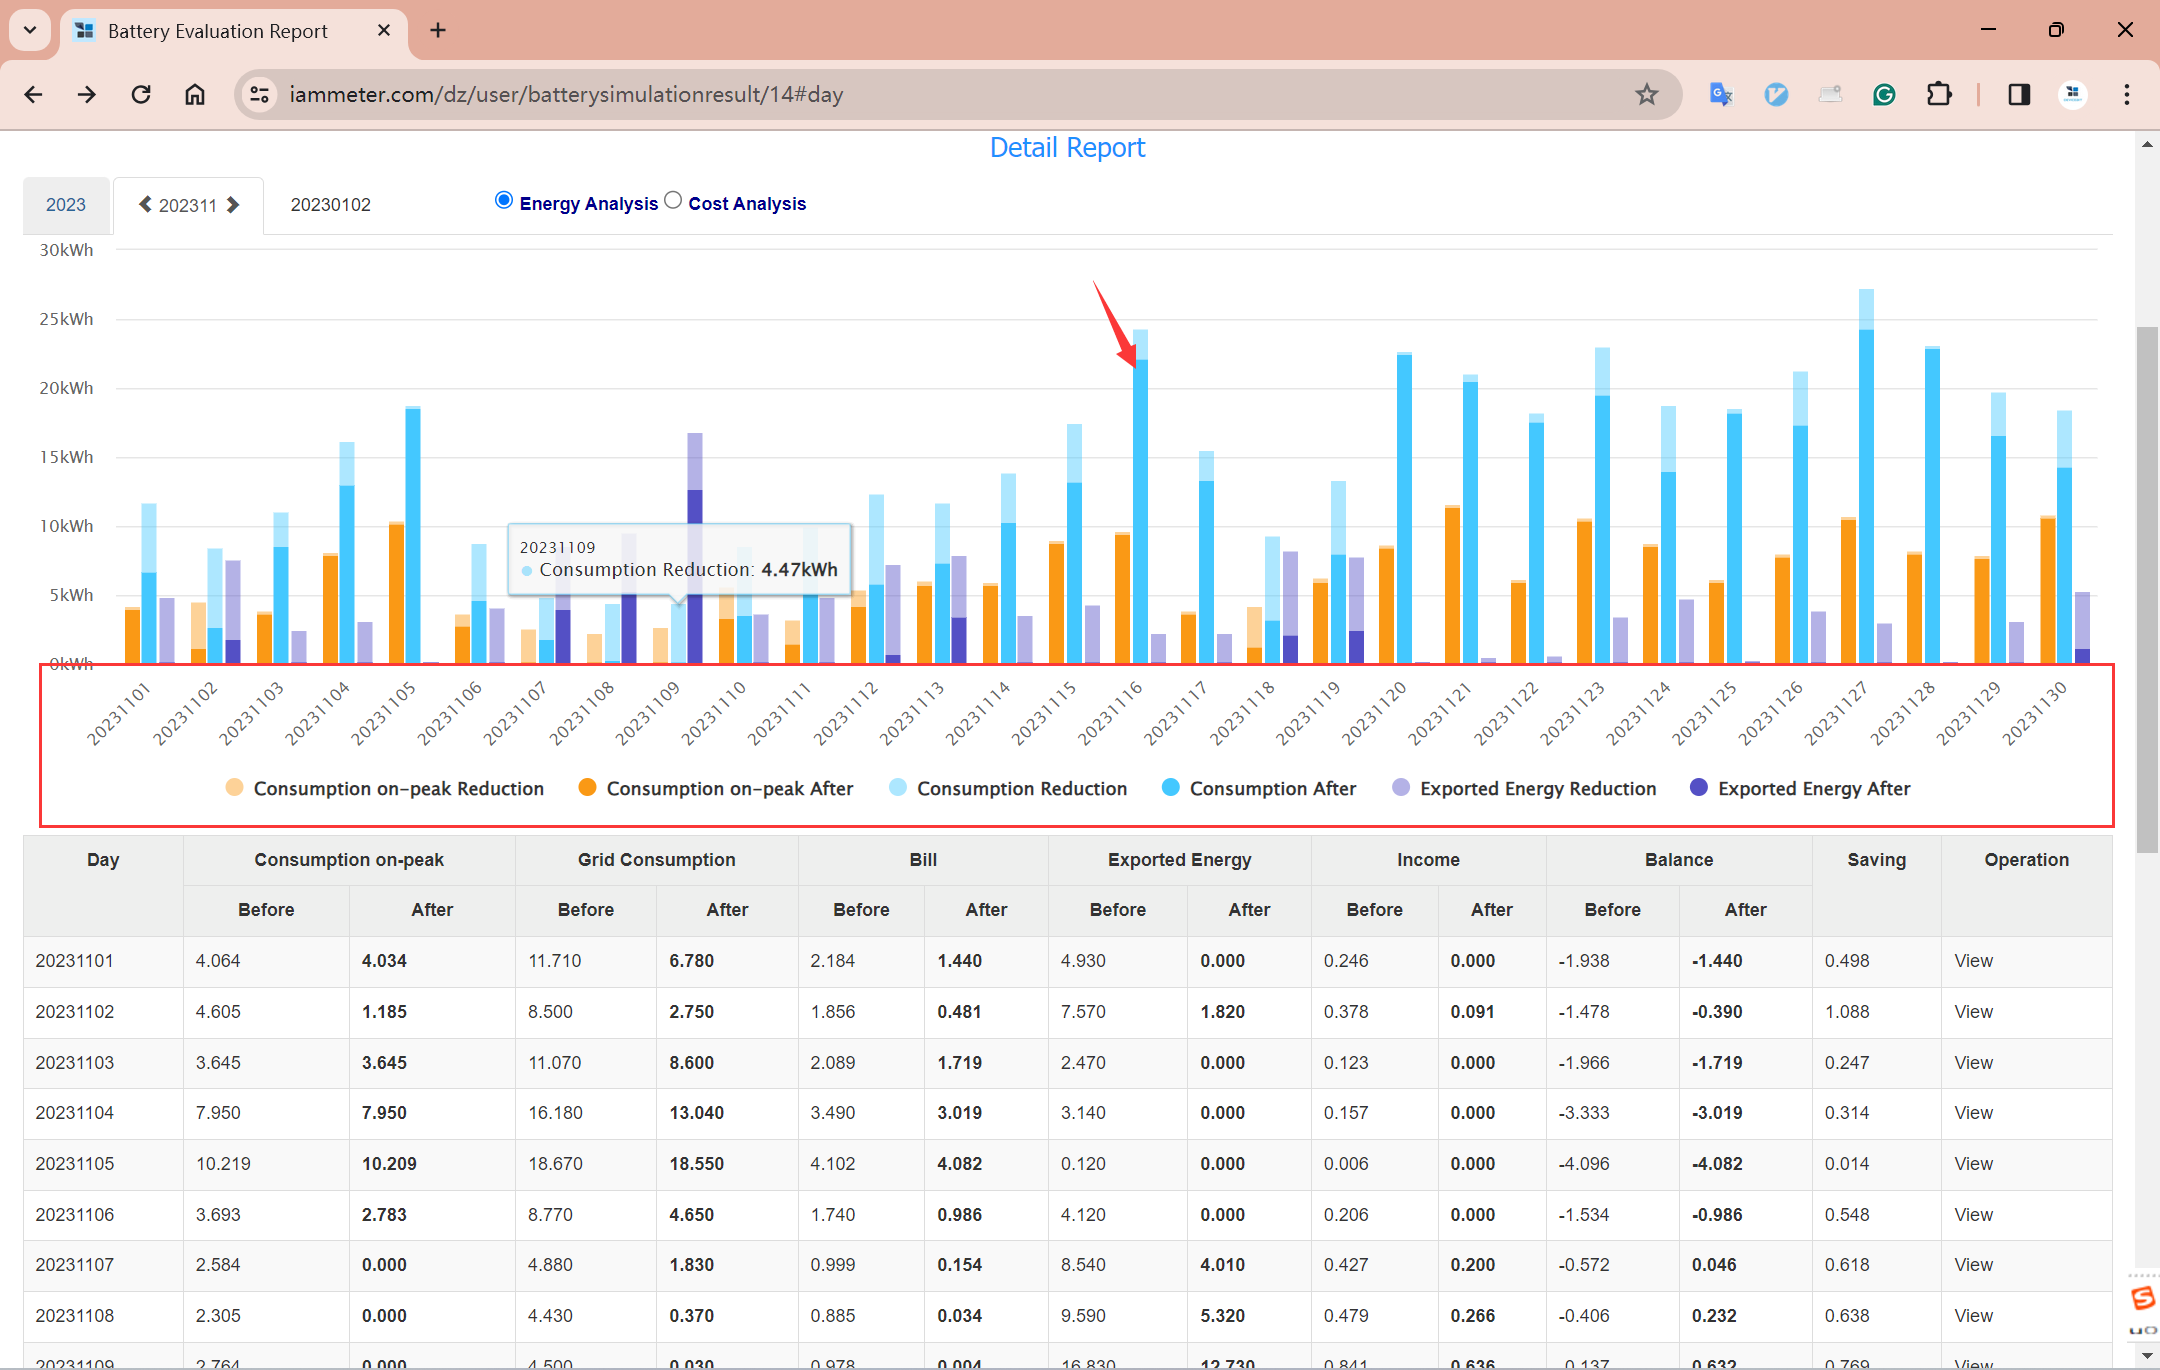
Clicking any bar in the chart can enter a specific month to see the data for each day of that month, such as clicking November in the chart below.
You can see the data for each day of November as shown below. "Before" is still the actual measured value (daily), and "After" is still the calculated value with "simulated battery" (daily).
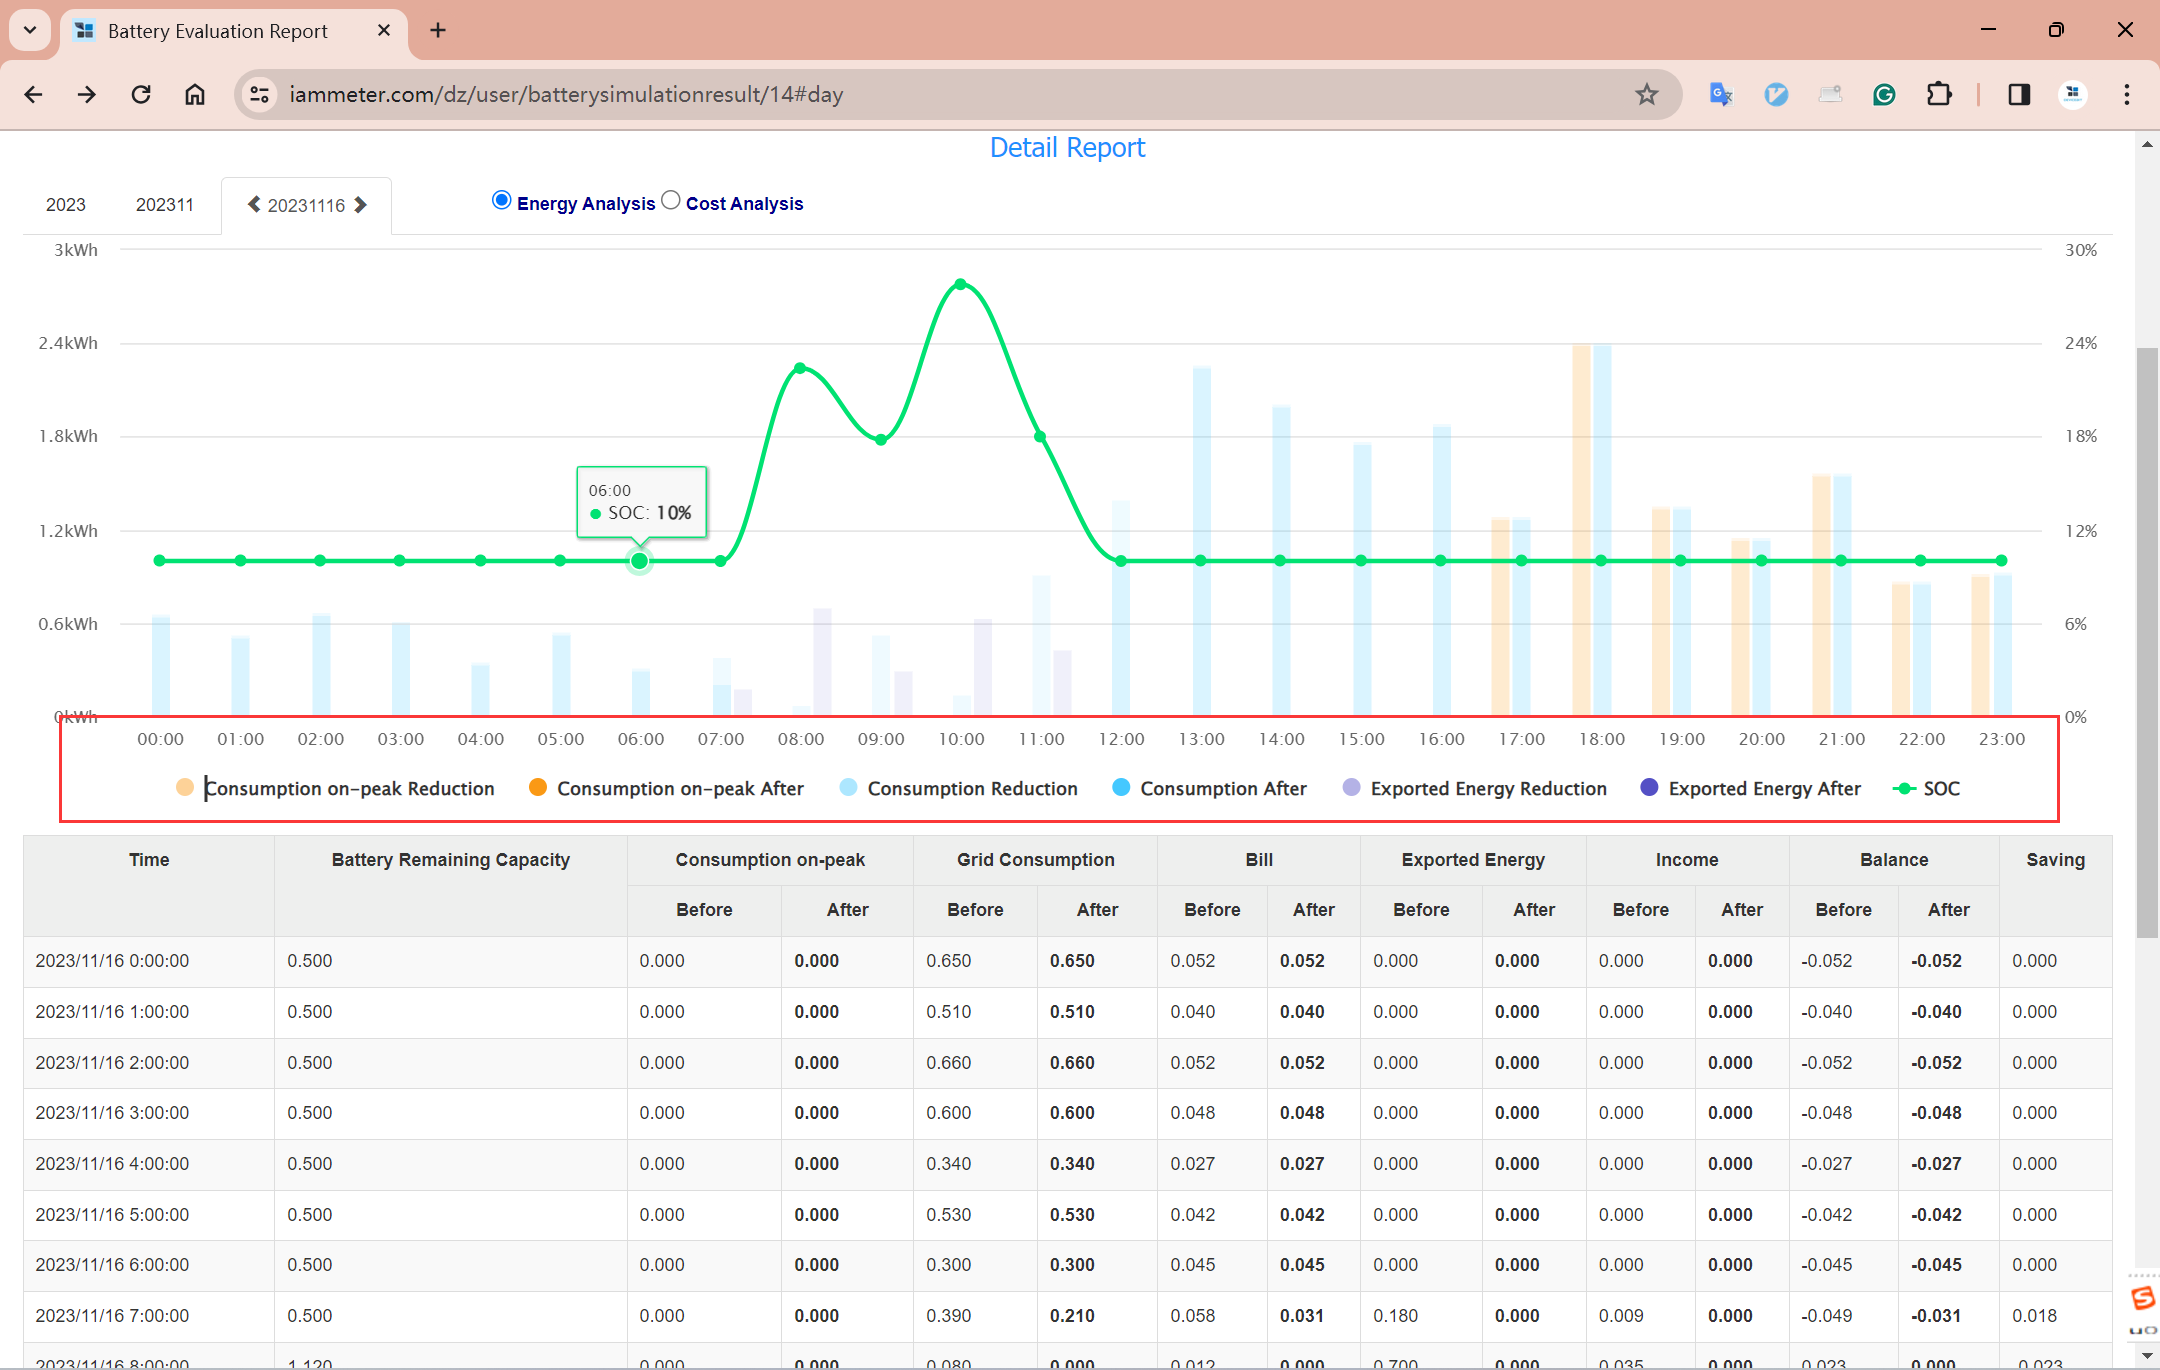
Similarly, clicking any day can enter a specific date to see the hourly data for that day, such as clicking November 16, 2023.
You can see the 24-hour data for November 16, 2023, "Before" is still the actual measured value (hourly), and "After" is still the calculated value with "simulated battery" (hourly).
Example 2: Battery operating in “TOU mode”
TOU is another operating mode of battery storage systems.
You can choose the discharging time, such as allowing the battery to discharge only during on-peak periods.
As shown in the figure below, after selecting the TOU operating mode, it further sets the battery to discharge only during the 17:00-24:00 period every day.
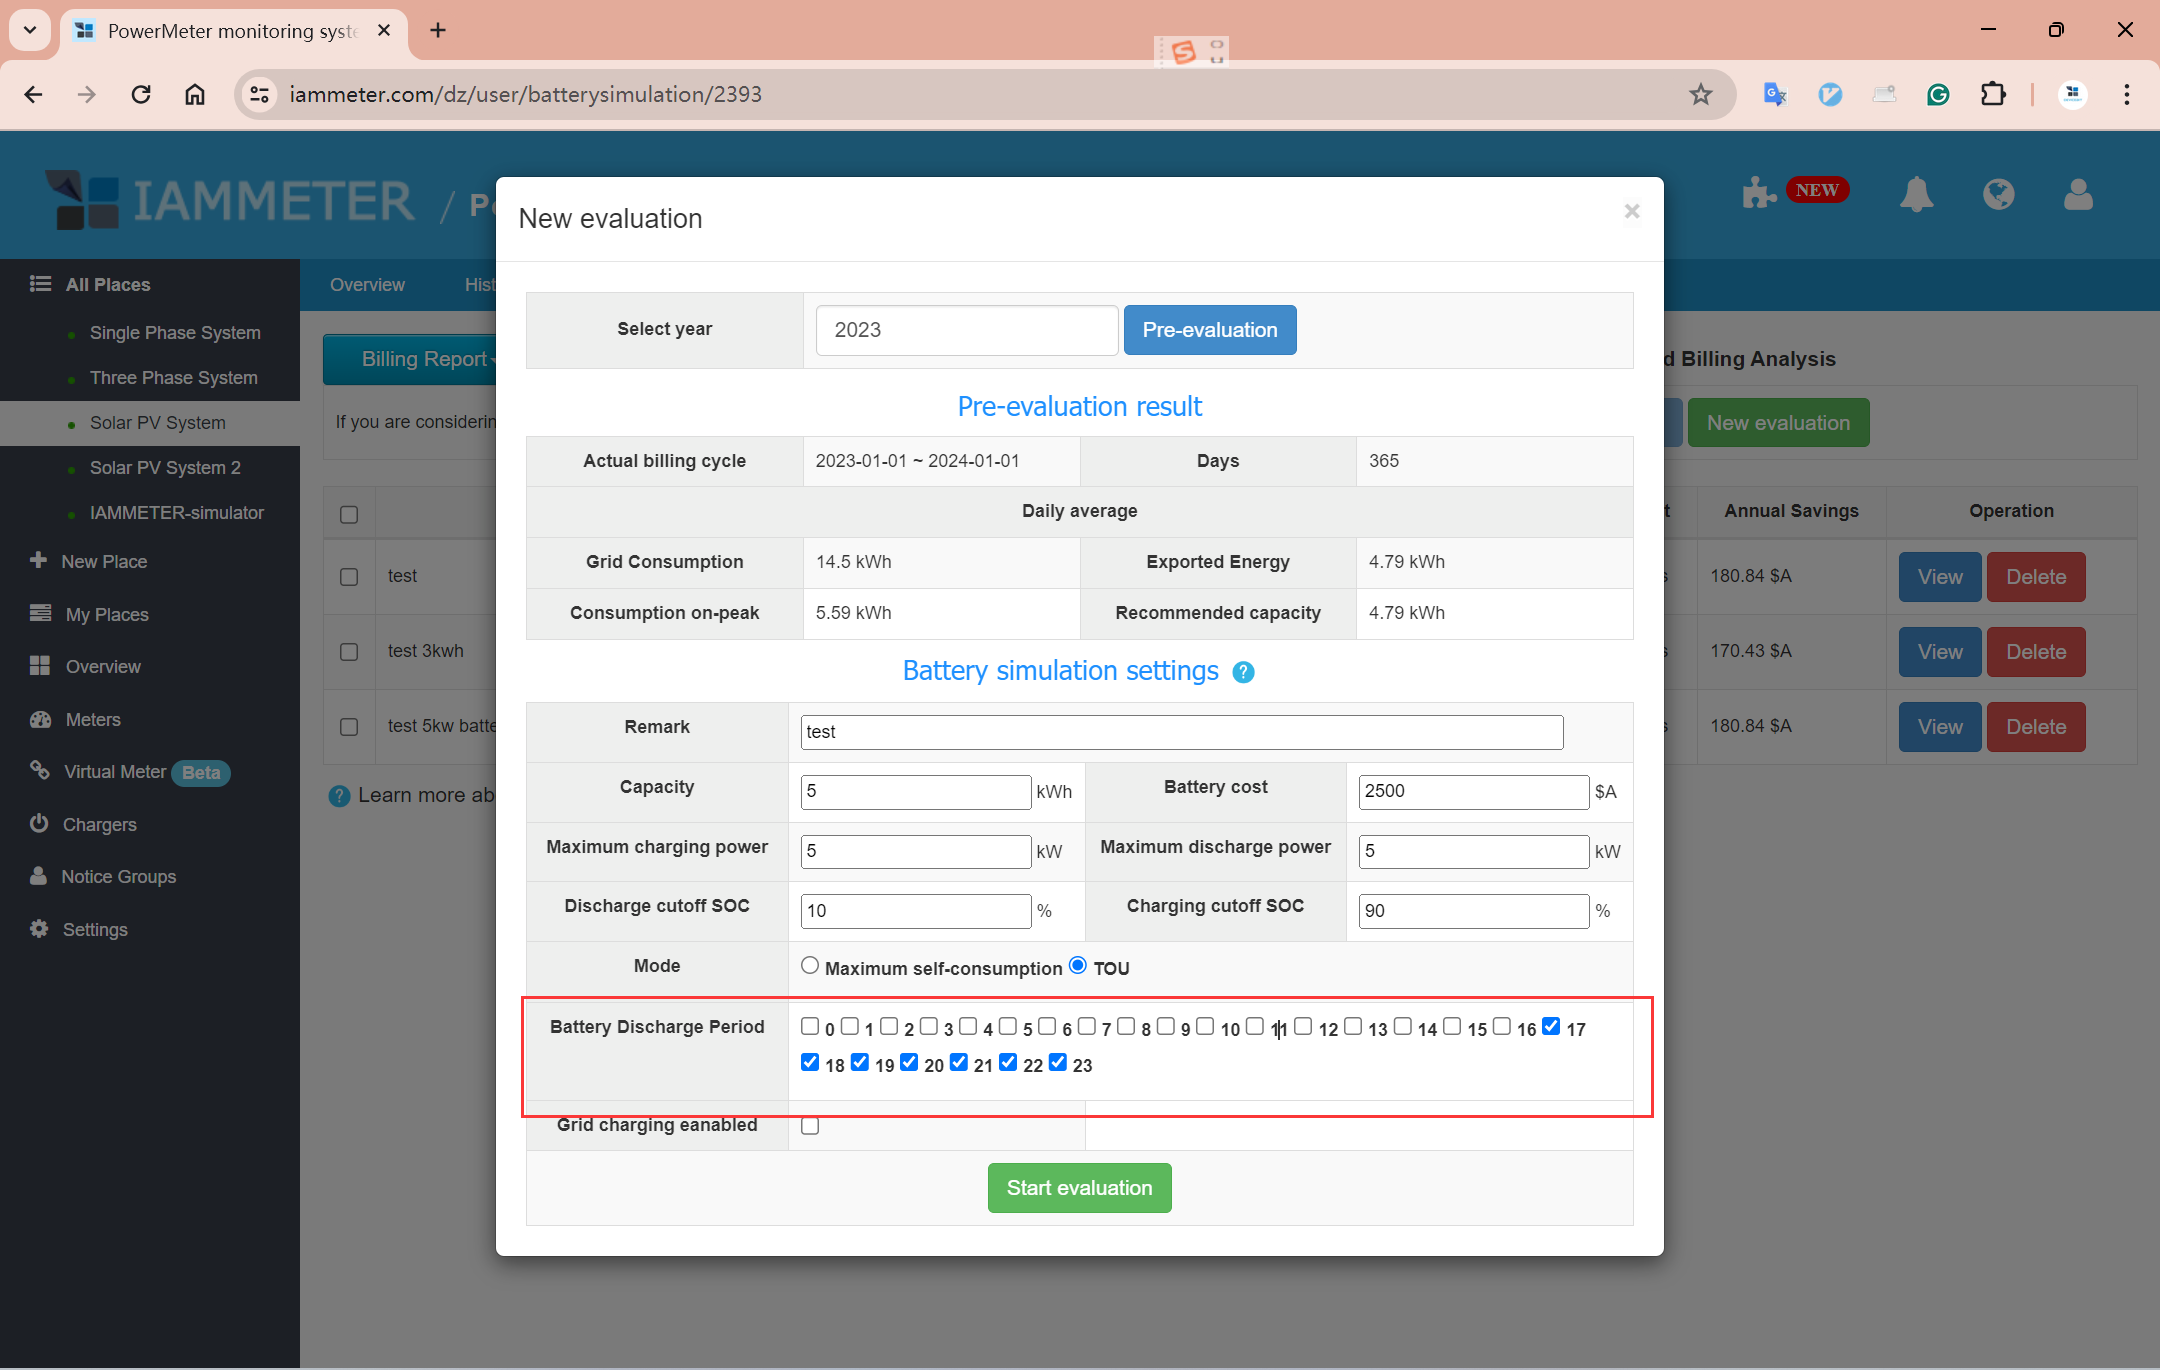
After setting, click "Start Evaluation" to start the assessment.
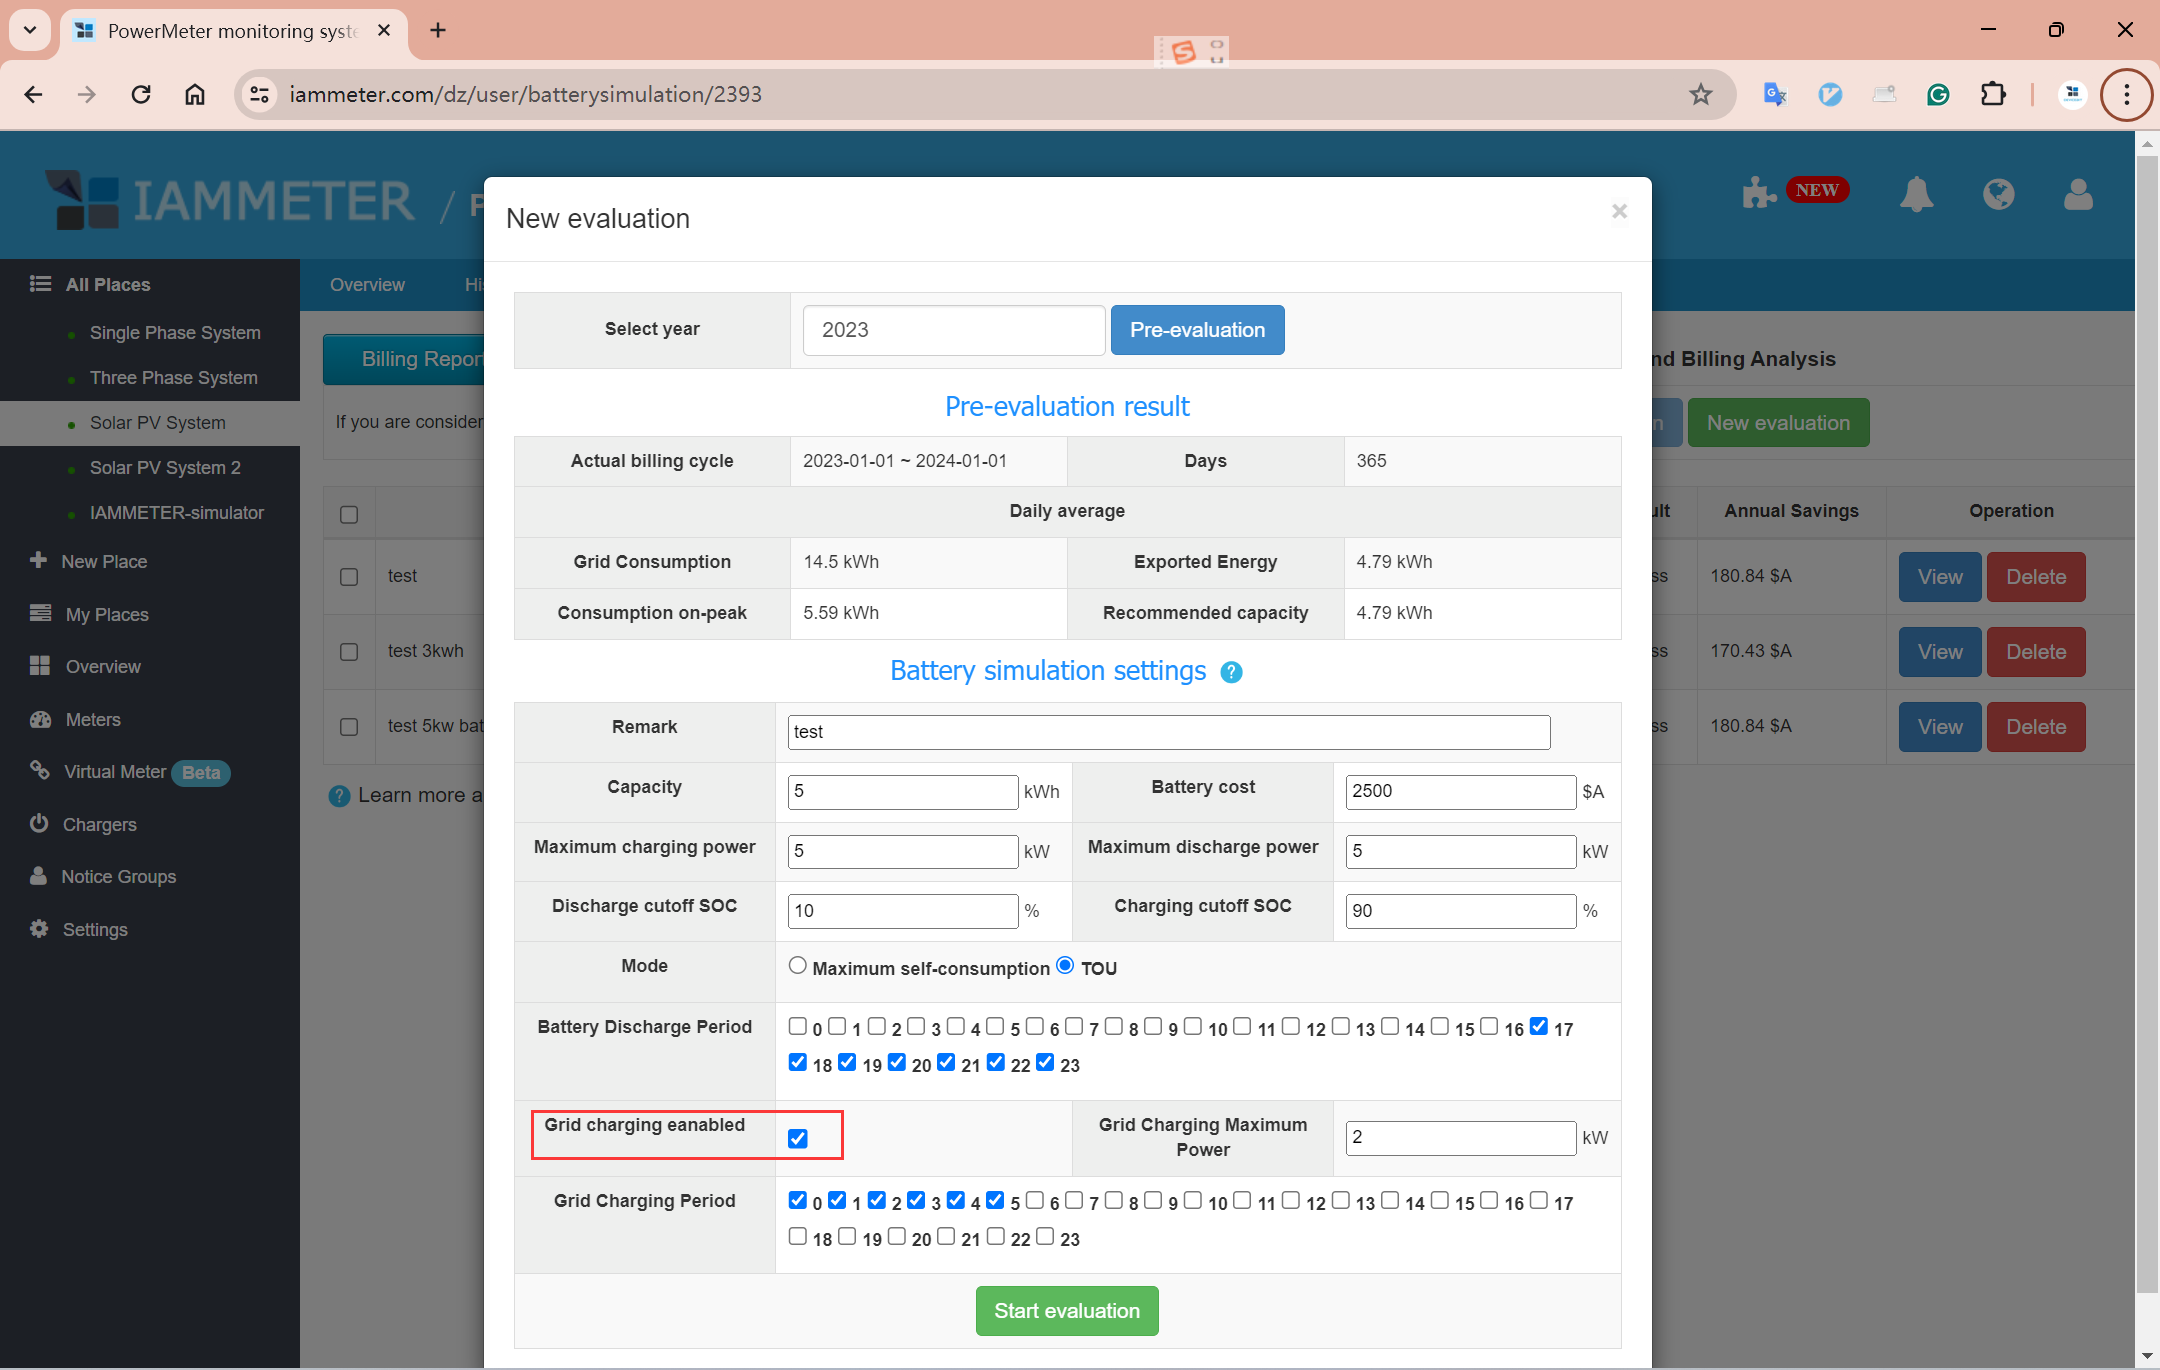
Example 3: Setting the grid to charge the battery
Perhaps you have not installed a photovoltaic system, but due to the large difference between peak and valley electricity prices, you can use the battery to charge during valley price periods and discharge during peak price periods.
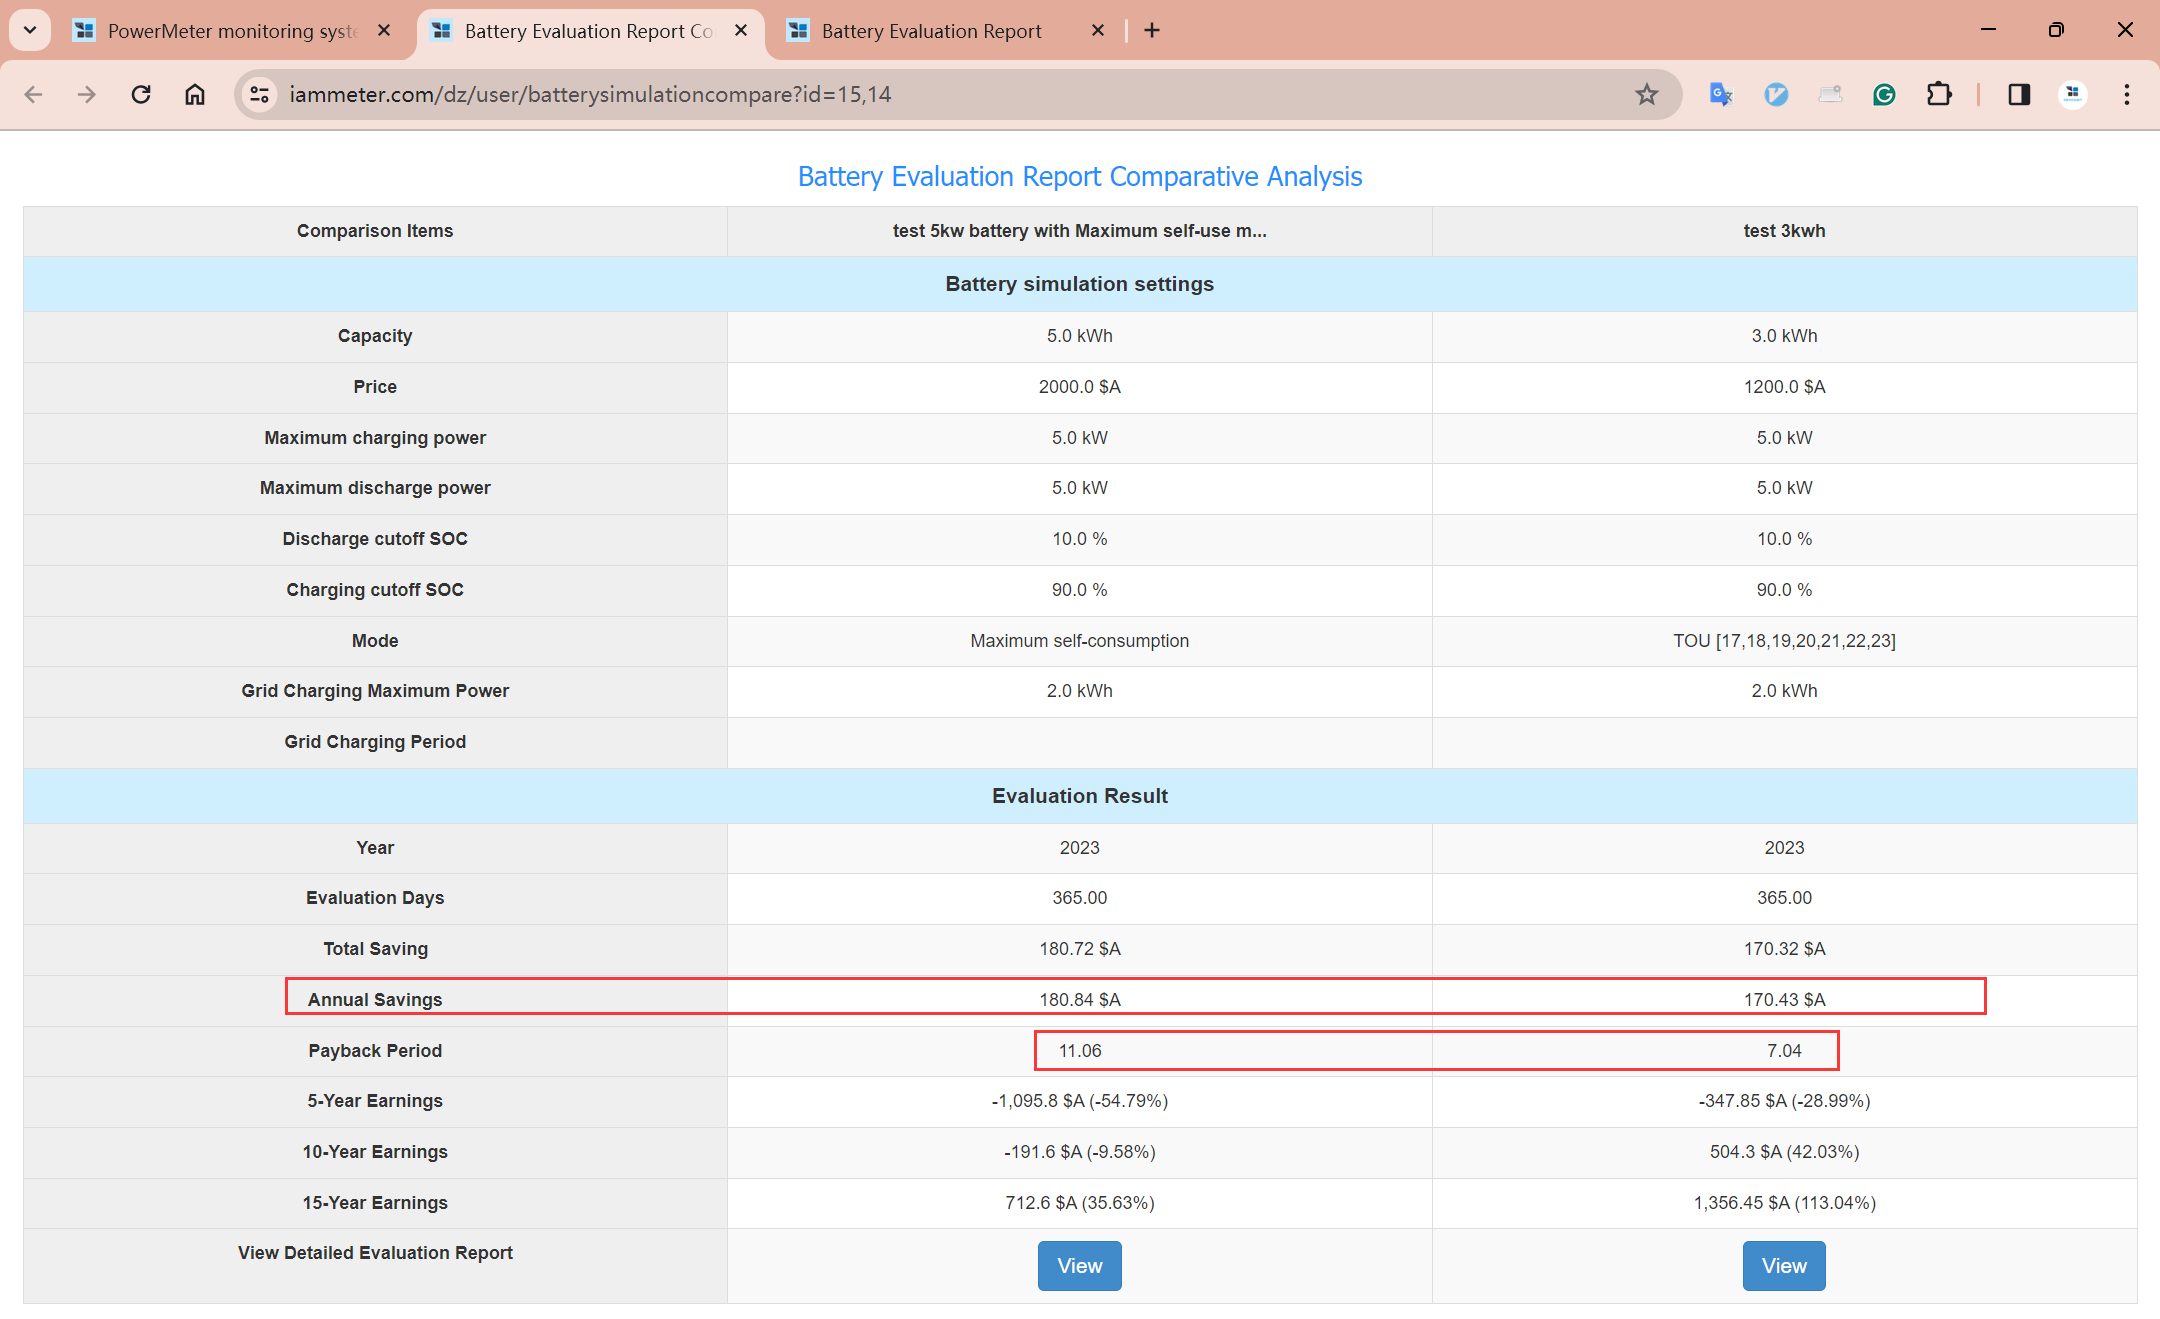
Example 4: Comparing the differences in benefits brought by different battery settings
We also offer a very practical feature that helps customers compare the effects of two battery storage systems with different parameter settings.
As shown in the figure below,we first use the same data as in Example 1, set up a 3kWh battery (Example 1 uses a 5kWh battery), and then set the discharge time from 17:00 to 24:00 (Example 1 allows discharge throughout the day), and generated a report.
It will take approximately 20 seconds to generate the report.
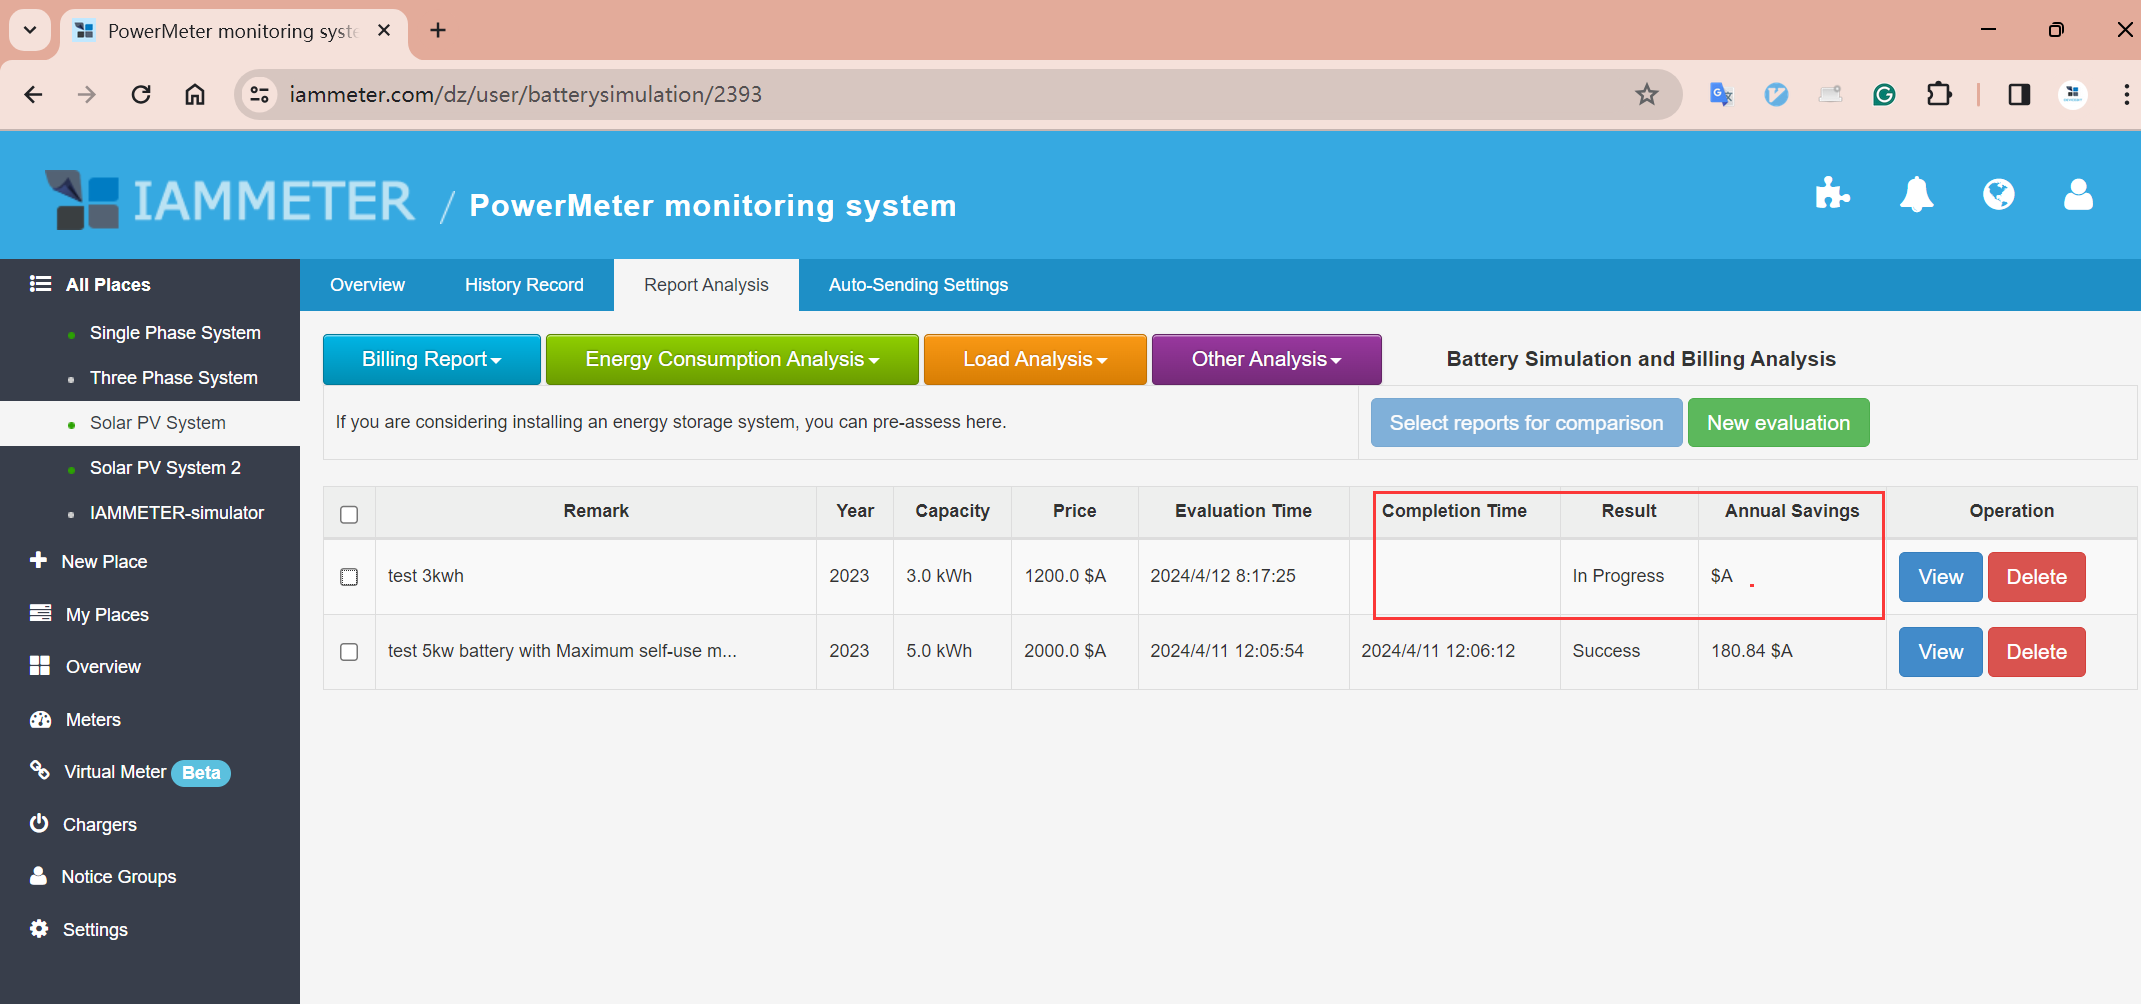
This is the content of the new report.
Now ,we compare these two reports.
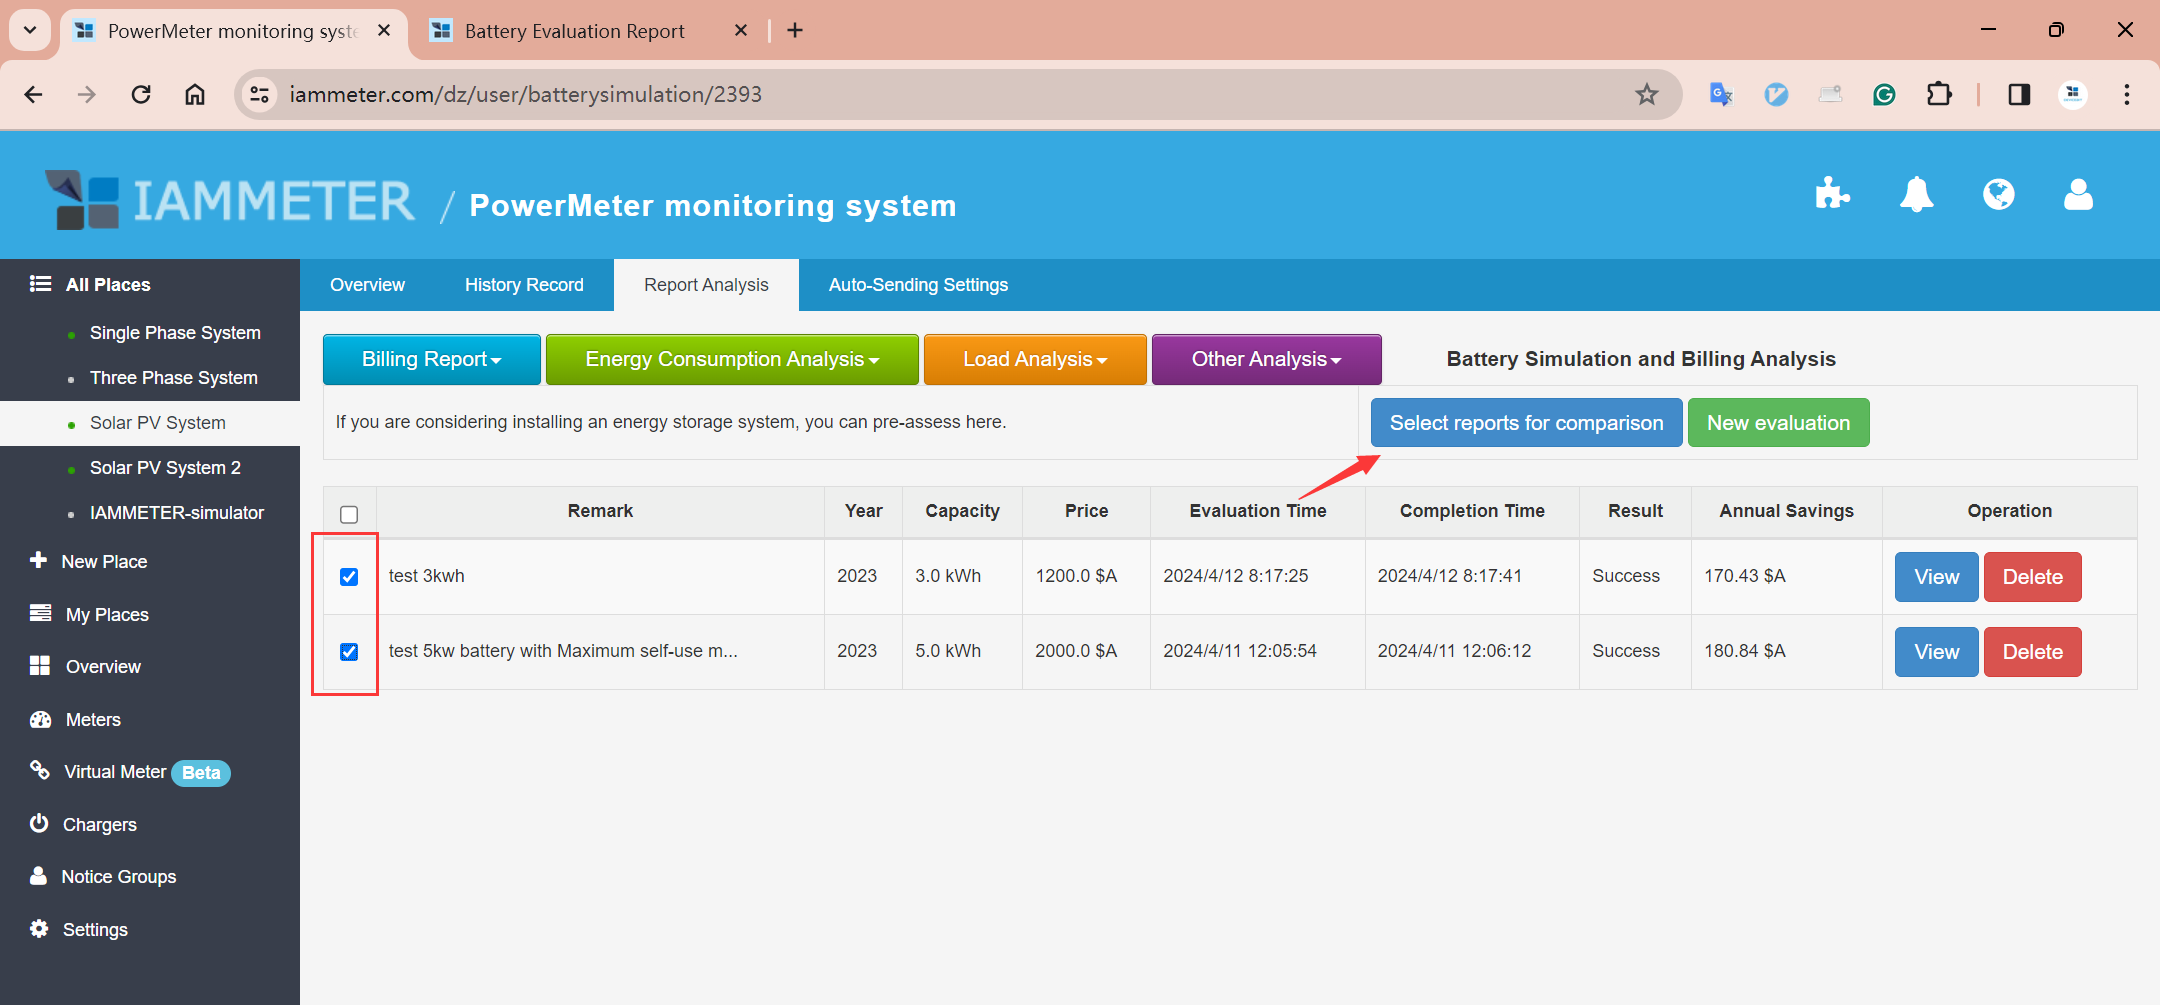
This comparison report indicates that the 3kWh solution is clearly better than the 5kWh solution for this site.
Feedback on This Report
This report is our latest attempt, welcome to let us know your result inhttps://imeter.club/
Reference
Monitor the solar PV in IAMMETER-1


")
")